
Virginia Snow Predictions 2026-2027: What the Records Show

NOAA publishes no seasonal snow forecast for Virginia. Here are the real 1991-2020 normals for nine cities, the snowiest months, and what El Nino does not tell you.
Advertisement
Virginia snow predictions for 2026-2027 come with a warning attached: nobody can give you a seasonal total, NOAA included. What the record does give you is the range, and it is enormous. Virginia averages 3.4 inches of snow a season at Virginia Beach, 8.8 at Richmond, and 47.1 up at Wise in the far south-west.
The Climate Prediction Center will not forecast seasonal snowfall at all, on the record, because it says snow is not predictable more than about a week ahead. So this page does the thing that is actually possible. Below are the measured normals for every Virginia city NOAA publishes, the months the snow falls in, the last five winters, where it fell deepest last year, the storms that set the records, and what this winter's El Niño does and does not tell you.
Every figure comes from NOAA or the National Weather Service and carries the period it covers. Where the data does not exist, we say so rather than fill the gap.
Does it snow in Virginia?
Yes, everywhere in the state, but the spread is wider than the gap between some whole states. Wise, in the south-west mountains, averages 47.1 inches a season. Virginia Beach averages 3.4. A fourteen-fold difference inside one state is why a single "Virginia snowfall" number tells you almost nothing.
The other half of the answer is frequency. Richmond records measurable snow of an inch or more on about 2.7 days in an average year. Norfolk manages 1.7. Snow is a real feature of a Virginia winter, but for most of the state it is an event that happens two or three times, not a season-long condition.
How much snow does Virginia get each year?
Between 3.4 and 21.0 inches a season at the airport stations that report for Virginia's cities, and up to 47.1 inches at mountain stations in the south-west. Below are the official NOAA 30-year normals for the cities, covering 1991 to 2020. The mountain figures come later.
| City | NOAA station | Seasonal normal, 1991-2020 |
|---|---|---|
| Washington Dulles (Northern Virginia) | Washington Dulles AP | 21.0 in |
| Roanoke | Roanoke Regional AP | 14.8 in |
| Lynchburg | Lynchburg Regional AP | 11.6 in |
| Bristol / Tri-Cities | Bristol Tri-City AP | 9.2 in |
| Richmond | Richmond International AP | 8.8 in |
| Wallops Island (Eastern Shore) | Wallops Island Flight Facility | 8.4 in |
| Danville | Danville Regional AP | 7.6 in |
| Norfolk | Norfolk International AP | 6.2 in |
| Virginia Beach | Oceana NAS | 3.4 in |
Two honest notes on that table. The Bristol station sits just over the line in Tennessee, which is where the official Tri-Cities observation has always been taken, so read it as the Tri-Cities figure rather than a Virginia one. And there is no statewide average in the list because NOAA does not publish one. Any site quoting a single Virginia figure has calculated it themselves without telling you how.
Why do different websites give different Virginia snowfall numbers?
Because they are quoting different 30-year periods without saying which. Richmond appears online as 8.8, 10.3 and 11 inches. All three can be defended: 8.8 is the current 1991-2020 normal, 10.3 was the 1981-2010 normal, and the third is somebody rounding. Normals are recalculated every ten years, so an old page is not necessarily wrong, just stale.
This is the single most common error in Virginia snow content, and almost nobody labels their period. Every number on this page is 1991-2020 and says so.
How much snow did Virginia get in the last 5 years?
Wildly different amounts, and that is the real lesson. Winter 2022-23 produced almost no measurable snow anywhere in Virginia. Two winters later, Norfolk took 16.8 inches, nearly three times its 6.2 inch normal, and more than Washington Dulles got in the same season.
| Season | Dulles | Richmond | Norfolk | Roanoke | Lynchburg |
|---|---|---|---|---|---|
| 2021-22 | 15.8 | 4.7 | 11.2 | 11.8 | 9.5 |
| 2022-23 | 0.4 | trace | trace | 0.4 | 0.5 |
| 2023-24 | 11.7 | 0.7 | trace | 4.1 | 2.7 |
| 2024-25 | 15.5 | 11.7 | 16.8 | 8.4 | 12.4 |
| 2025-26 | 13.6 | 13.0 | 5.6 | 13.9 | 12.1 or more |
| 30-year normal | 21.0 | 8.8 | 6.2 | 14.8 | 11.6 |
Inches per season, running July to June. "Trace" means snow was observed but too little to measure, not that none fell.
How these were put together, because it matters: the Dulles figures for 2021-22 to 2024-25 are published season totals from the National Weather Service. Everything else we added up ourselves from the monthly NWS and ACIS records, because no agency publishes a ready-made seasonal table for those stations. We checked the method by running Dulles through it, and it reproduced the published totals exactly. These are preliminary observations rather than certified records.
Two caveats on the last row. The Weather Service has published Dulles monthly values for 2025-26 but left the season cell blank, so 13.6 is our sum of its own monthlies. Lynchburg is missing one day, 1 February 2026, so its season is at least 12.1 inches and possibly a little more.
Read the columns downward and the point lands hard. Richmond had two near-snowless winters back to back, then 11.7 and 13.0. Norfolk swung from nothing to 16.8 to 5.6 in three years. Not one of these five seasons looks like the 30-year normal in the bottom row, which is exactly what an average made of extremes does.
Virginia is not unusual in this. The same swing shows up wherever snow arrives in a few big storms rather than steadily, which is most of the eastern United States. We track it nationally in our state-by-state US snow forecast round-up.
Where did it snow most in Virginia last winter?
The highest totals reported to the National Weather Service in 2025-26 came from the northern Virginia and Shenandoah side of the state, in a single storm on 25 January 2026. Cedar Grove in Frederick County led with 11.8 inches.
| Place | County | Total | Storm date |
|---|---|---|---|
| Cedar Grove | Frederick | 11.8 in | 25 Jan 2026 |
| Wallops Island area | Accomack | 11.0 in | 22-23 Feb 2026 |
| Berryville | Clarke | 9.8 in | 25 Jan 2026 |
| Ashburn | Loudoun | 9.8 in | 25 Jan 2026 |
| Wares Crossroads | Louisa | 9.7 in | 25 Jan 2026 |
| Leesburg | Loudoun | 9.5 in | 25 Jan 2026 |
| Burkeville | Nottoway | 8.0 in | 8 Dec 2025 |
Call these the highest reported totals rather than the highest in Virginia, because that is what they are. The Weather Service office at Blacksburg, which covers the western high country around Mount Rogers and Whitetop, published no event summaries for winter 2025-26 at all. Those ridges very probably beat 11.8 inches. Nobody published a number, so we are not going to invent one.
How many days does it snow in Virginia?
Rarely, and this is where the averages mislead. Dulles records an inch or more of snow on 5.3 days in an average year. Roanoke 3.8, Richmond 2.7, Lynchburg 2.7, Norfolk 1.7. For most of Virginia, the entire seasonal total arrives inside a handful of days.
| City | Days per year with 1 inch or more | Average season | Median season |
|---|---|---|---|
| Washington Dulles | 5.3 | 21.0 in | not published |
| Roanoke | 3.8 | 14.8 in | not published |
| Wallops Island | 3.0 | 8.4 in | not published |
| Richmond | 2.7 | 8.8 in | 7.8 in |
| Lynchburg | 2.7 | 11.6 in | not published |
| Norfolk | 1.7 | 6.2 in | 3.0 in |
Look at the last two columns for Norfolk. The average is 6.2 inches. The median is 3.0. In a typical Norfolk winter you get about three inches, and the 6.2 figure exists because a handful of monster winters drag the mean upward. Norfolk's snowiest season on record, 1979-80, delivered 41.9 inches, nearly seven times the average.
Richmond's mean and median sit much closer together, 8.8 against 7.8, so Richmond's average is a fair description of a normal winter. Norfolk's is not. If you are planning around eastern Virginia snow, plan around the median.
Advertisement
The National Weather Service publishes both figures for Richmond and Norfolk. It does not publish medians for the other stations, so those cells stay empty rather than get filled with arithmetic of our own.
What is the snowiest month in Virginia?
It depends on the city, and the split runs roughly north-west against south-east. January is snowiest in Richmond, Norfolk, Virginia Beach and Wallops Island. February edges it in Dulles, Roanoke and Lynchburg. Danville and Bristol are dead level between the two.
| Station | Nov | Dec | Jan | Feb | Mar | Apr |
|---|---|---|---|---|---|---|
| Washington Dulles | 0.3 | 2.8 | 6.9 | 7.0 | 3.9 | 0.1 |
| Roanoke | 0.1 | 3.2 | 4.3 | 4.8 | 2.3 | 0.1 |
| Lynchburg | 0.0 | 2.0 | 3.5 | 3.6 | 2.4 | 0.1 |
| Bristol Tri-City | 0.3 | 1.7 | 3.0 | 3.0 | 1.1 | 0.1 |
| Richmond | 0.0 | 1.8 | 3.7 | 2.2 | 1.1 | 0.0 |
| Wallops Island | 0.0 | 1.7 | 3.5 | 2.3 | 0.7 | 0.2 |
| Danville | 0.0 | 1.1 | 2.5 | 2.5 | 1.5 | 0.0 |
| Norfolk | 0.0 | 1.1 | 3.2 | 1.5 | 0.4 | 0.0 |
| Virginia Beach (Oceana) | 0.0 | 0.4 | 2.2 | 0.8 | 0.0 | 0.0 |
Inches, NOAA monthly normals 1991-2020. Each row sums to that station's seasonal total in the table above.
November is close to nothing statewide. April is a rounding error everywhere except Wallops Island, which posts 0.2 inches. March still matters in the west: Roanoke averages 2.3 inches in March, more than Norfolk gets in January.
What is the snowiest place in Virginia?
Wise, in the far south-west, at 47.1 inches a season. Burkes Garden in Tazewell County is second at 46.9. Both collect more than double what Washington Dulles gets, and neither appears in the airport-based tables that most websites reprint.
We pulled every Virginia station in NOAA's 1991-2020 normals to settle this. Of the 105 with a published snowfall figure, these are the ten deepest.
| # | Station | Seasonal normal, 1991-2020 |
|---|---|---|
| 1 | Wise 1SE | 47.1 in |
| 2 | Burkes Garden | 46.9 in |
| 3 | Mustoe 1 SW | 39.1 in |
| 4 | Clintwood 1W | 38.4 in |
| 5 | Nora 4 SSE | 38.3 in |
| 6 | Mill Gap | 33.7 in |
| 7 | Bland | 26.9 in |
| 8 | Hot Springs | 25.3 in |
| 9 | Star Tannery | 25.1 in |
| 10 | Blacksburg NWSO | 24.7 in |
Compare that list against the city table higher up and the whole confusion explains itself. Virginia's familiar city numbers come from airport stations, which sit in valleys, near cities, at low elevation. The snowiest places in the state are small co-operative observer stations up in the mountains, and they never appear under a heading like "Virginia snowfall by city". Roanoke's airport reads 14.8 inches. Wise, further west and much higher, reads 47.1.
So both answers you see online are half right. Virginia averages under 10 inches in most of the places people live, and over 45 in the corner of the state almost nobody quotes.
One correction while we are here. A widely shared page puts Wise in the Blue Ridge Mountains. Wise County sits in the Cumberland Plateau, in the far south-west, nearer to Kentucky than to the Blue Ridge.
Elevation is not the only driver either. Dulles is at just 313 feet and still out-snows Roanoke's airport, because how far north and how far from the ocean you are counts too.
How much snow does Charlottesville get?
There is no official figure, which is not the answer anyone wants. Charlottesville Airport and Big Meadows in Shenandoah National Park both sit in NOAA's 1991-2020 Climate Normals with the snowfall value left blank. Numbers circulate for both, but none of them is a published 30-year normal.
Blacksburg shows why this matters. Its airport station has no snowfall normal either, but the Weather Service office station nearby does, and it reads 24.7 inches. Same town, one number published and one not. When a page tells you what a Virginia town averages, the station it picked is doing most of the work.
Virginia snow predictions for winter 2026-2027
No agency forecasts a Virginia snowfall total for 2026-27, because none can. What is close to settled is El Niño. On 9 July 2026 the Climate Prediction Center put it at 100 percent for December through February, with an 81 percent chance it runs "very strong" from October to December.
That far-out call is possible only because ocean temperatures move slowly. Snowfall does not.
What CPC will not do is turn that into a snow total. Its seasonal outlooks cover temperature and total precipitation in three-month blocks, as shifts in the odds. NOAA states the reason plainly: the outlook does not project seasonal snowfall because snow forecasts are "generally not predictable more than a week in advance."
| Claim you will see | What the source actually supports |
|---|---|
| "Virginia will get X inches this winter" | No agency forecasts seasonal snowfall. CPC says it is not predictable beyond about a week. |
| "El Niño means a snowy Virginia" | Composites tilt the odds snowier in the Mid-Atlantic. NOAA calls composites retrospectives, "not a forecast." |
| "The almanac predicts a cold, snowy winter" | Audited against five winters, almanac skill was indistinguishable from random guessing. |
| "Forecasters expect a big storm in January" | Deterministic forecasting breaks down at roughly 10 to 14 days. No named month is forecastable in July. |
The almanacs have actually been audited. The Colorado Climate Center, run by that state's climatologist, scored the Farmers' Almanac against the Climate Prediction Center across five winters from 2019 to 2024. The almanac scored +1. CPC scored +24. Its conclusion was that almanac winter forecasts could not be told apart from picking at random.
Even CPC's own precipitation outlooks beat random chance only modestly. Honest seasonal forecasting nudges odds, it does not predict outcomes. We pull that apart properly in our look at how almanac forecasts stack up against the actual science.
The Old Farmer's Almanac had not published its detailed Virginia forecast for 2026-27 when we checked on 20 July 2026. Those usually appear in late August or September, and we will update this page when it does.
Does El Niño mean more snow in Virginia?
It tilts the odds, and the signal is weaker than almost everyone claims. NOAA's composites of El Niño winters from 1950 to 2009 do show snowier-than-average conditions across the Mid-Atlantic and southern Appalachians, but NOAA warns the sample runs to only about 20 events.
The sharper finding comes from the National Weather Service office at Baltimore/Washington, which serves Northern Virginia. Its own analysis concludes local snowfall depends more on the North Atlantic Oscillation than on El Niño or La Niña. Above-normal snow winters cluster where the NAO was neutral to negative, whatever ENSO was doing. Since 1950, only one above-normal snow winter occurred under a moderate or strong La Niña, and only one under a positive NAO.
The record 2009-10 winter at Dulles, 73.2 inches, came from a moderate El Niño and a strongly negative NAO together. Not El Niño alone.
Here is why that matters in July. The NAO cannot be predicted months ahead. So the one driver we can see coming is the one that does not decide Virginia's winter, and the one that does decide it stays invisible until about a fortnight out.
Virginia is not alone in this. The same limitation applies to every state we cover, including our Maryland snowfall records and outlook just across the Potomac.
What was the biggest snowstorm in Virginia history?
The largest storm total in Virginia's observational record is 49 inches at Big Meadows, in Shenandoah National Park, over 6 to 8 January 1996. Thirty-two of those inches fell on 7 January alone. Down in the cities the same blizzard was far smaller, and Richmond's own biggest event remains 21.6 inches from January 1940.
Advertisement
We took the Big Meadows figure from the station's daily observations rather than from another website: 16.0 inches on the 6th, 32.0 on the 7th, 1.0 on the 8th. One caveat we will not hide, 5 January is marked missing in that record, so the true storm total may be a little higher still.
That single day of 32.0 inches is worth sitting with. It is more snow in 24 hours than Roanoke, Richmond, Norfolk and Virginia Beach get in an average year put together.
Among the long-running city stations, Richmond's snowiest day is 19.9 inches on 24 January 1940, a record now 85 years old, and Norfolk's biggest event is 18.6 inches on 27-28 December 1892.
| Record | Richmond | Norfolk | Washington Dulles |
|---|---|---|---|
| Snowiest season | 38.9 in (1961-62) | 41.9 in (1979-80) | 73.2 in (2009-10) |
| Biggest single storm | 21.6 in (Jan 1940) | 18.6 in (Dec 1892) | 32.4 in (Feb 2010) |
| Biggest single day | 19.9 in (24 Jan 1940) | 17.5 in (27 Dec 1892) | 19.8 in (7 Jan 1996) |
The named storms most Virginians remember:
- Blizzard of January 1996. Dulles measured 24.6 inches over 6-8 January, with 19.8 of it on the 7th.
- Snowmageddon, February 2010. Dulles took 32.4 inches over 5-6 February, its highest two-day total on record. February 2010 finished at 46.1 inches, the snowiest single month Dulles has ever recorded.
- Winter Storm Jonas, January 2016. Dulles 29.3 inches over 22-23 January. In eastern Virginia the biggest confirmed report was 19.0 inches at Biltmore in Henrico County, while Norfolk took 1.9.
- The I-95 storm, January 2022. The maximum was 13.4 inches at Gordonsville in Louisa County. Richmond city reported 3.0 to 3.5 inches. That was enough to close I-95 near Fredericksburg with drivers stranded over 24 hours and knock out power to nearly 450,000 customers.
That last one is the most useful storm on the list, because it is the smallest. Thirteen inches at its worst, nowhere near a record, and it still shut a stretch of I-95 for a day. In Virginia the storm that disrupts your trip is rarely the historic one.
Why does Virginia close schools and roads for two inches of snow?
Because two or three snow days a year does not pay for a northern state's plow fleet, and the arithmetic is not close. Richmond gets an inch or more of snow on 2.7 days in an average year. Norfolk manages 1.7.
A city buying plows and stockpiling salt for that is buying kit that sits idle 363 days out of 365, paid for by residents who would rather the money went somewhere they can see it.
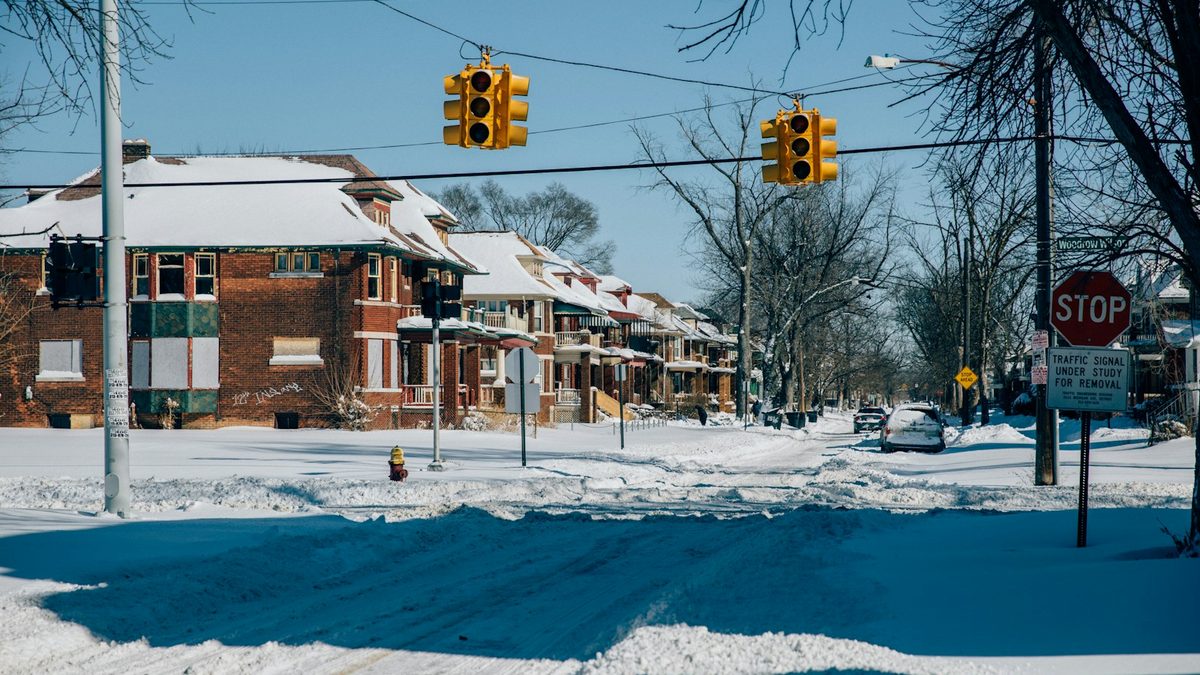
So Virginia takes the trade knowingly: fewer plows, and the roads go bad when it snows. January 2022 is what that looks like when a storm lands on the wrong stretch of interstate at the wrong hour. Just over 13 inches at its heaviest, and I-95 became impassable for a day.
If you are moving to Virginia from further north, this is the adjustment. It is not that Virginia handles snow badly by accident. It is that clearing snow properly costs more than the snow costs.
Where can you see snow in Virginia?
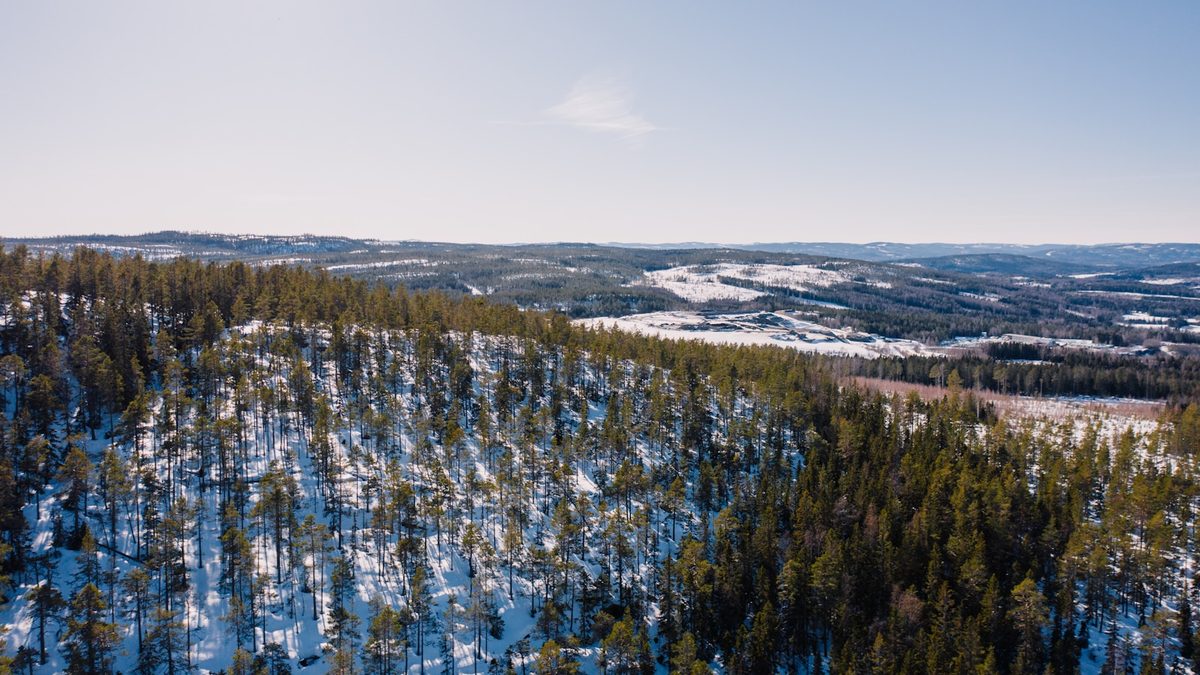
North and west, and the data says so bluntly. Dulles at 21.0 inches gets six times what Virginia Beach gets at 3.4, with Roanoke at 14.8 and Lynchburg at 11.6 in between. If snow is the point of the trip, aim at the Blue Ridge or the south-west, in January or February.
Two practical warnings before you drive.
First, Skyline Drive through Shenandoah National Park closes in winter weather, and a serious storm can shut all 105 miles of it for days. Check the park's road status page the morning you travel, not the night before. Park entrances that are not on Skyline Drive generally stay open when the Drive itself is closed, so a closure notice does not always mean the park is shut.
Second, do not plan a trip around a forecast issued more than about a week out. Everything above this section explains why. Watch the seven-day forecast, and keep the plan loose.
Where can you ski in Virginia?
Four resorts: Wintergreen in Nelson County, Massanutten near Harrisonburg, Bryce in Shenandoah County, and the Omni Homestead at Hot Springs. Wintergreen is the largest. All four sit in the Blue Ridge or Allegheny mountains, in the snowiest quarter of the state.
The thing worth knowing before you book is that Virginia skiing runs on snowmaking, not weather. Look at the 2022-23 row in the table above: Dulles managed 0.4 inches for the entire season, Roanoke 0.4. A resort waiting on natural snow would not have opened. Wintergreen runs several hundred snowguns for exactly this reason.
So the ski season here is far more reliable than Virginia's snowfall record suggests, and it depends on cold nights rather than snowy days. Check each resort's own site for opening and closing dates, which move every year with the temperature.
Sources
- NOAA National Centers for Environmental Information, US Climate Normals 1991-2020, annual/seasonal and monthly snowfall normals for all 452 Virginia stations. Accessed 20 July 2026.
- NWS Wakefield, Richmond snowfall records and top-10 lists, and the same for Norfolk. Accessed 20 July 2026.
- NWS Baltimore/Washington, Dulles season-by-season snowfall, 1962-63 to 2025-26. Accessed 20 July 2026.
- NWS Wakefield, all-time record snowfall events. Accessed 20 July 2026.
- NWS Baltimore/Washington, "Snowfall and Cold" historic storm summaries. Accessed 20 July 2026.
- NWS Wakefield event summaries for 23 January 2016 and 3 January 2022. Accessed 20 July 2026.
- NWS Wakefield winter storm summaries for 8 December 2025, 25 January 2026, 31 January 2026 and 22-23 February 2026. Accessed 20 July 2026.
- NOAA Climate Prediction Center, ENSO Diagnostic Discussion issued 9 July 2026, and its seasonal outlook issued 16 July 2026. Accessed 20 July 2026.
- NOAA Climate.gov on why the winter outlook does not project seasonal snowfall. Accessed 20 July 2026.
- NWS Baltimore/Washington, "ENSO and NAO vs. Local Winter Snowfall". Accessed 20 July 2026.
- Colorado Climate Center, "Should you use the Farmers' Almanac winter forecast?", 23 August 2024. Accessed 20 July 2026.
- Applied Climate Information System (NOAA Regional Climate Centers), daily and monthly station observations, used for the last five seasons and the Big Meadows totals of January 1996. Accessed 20 July 2026.
Researched and drafted with AI assistance, then fact-checked against the NOAA and National Weather Service sources listed above on 20 July 2026. Every snowfall figure on this page was read from a NOAA or NWS publication, not from a secondary weather site. Where a number is not published, we have said so rather than estimate it. We have not taken our own snow measurements in Virginia.
Topics
Frequently asked questions
Advertisement