White Thanksgiving Odds 2026: Chances by City, Plus the Moving Date

Thanksgiving moves every year, unlike Christmas. Here's how that changes snow odds by city, and what this week's polar vortex talk means for 2026.
Advertisement
Most of the US has single-digit odds of a white Thanksgiving, and only Anchorage clears 50%. That is the historical base rate. This year adds a live wrinkle: forecast models are showing a polar vortex disruption beginning as early as the second week of November, which would be the earliest on record, right as a Super El Niño is taking hold. The last Thanksgiving with significant snow on the ground in more than 20 states was 2019. Whether 2026 breaks that streak depends on a tug-of-war nobody can call yet. The odds below are the long-run record, not a forecast for November 26.
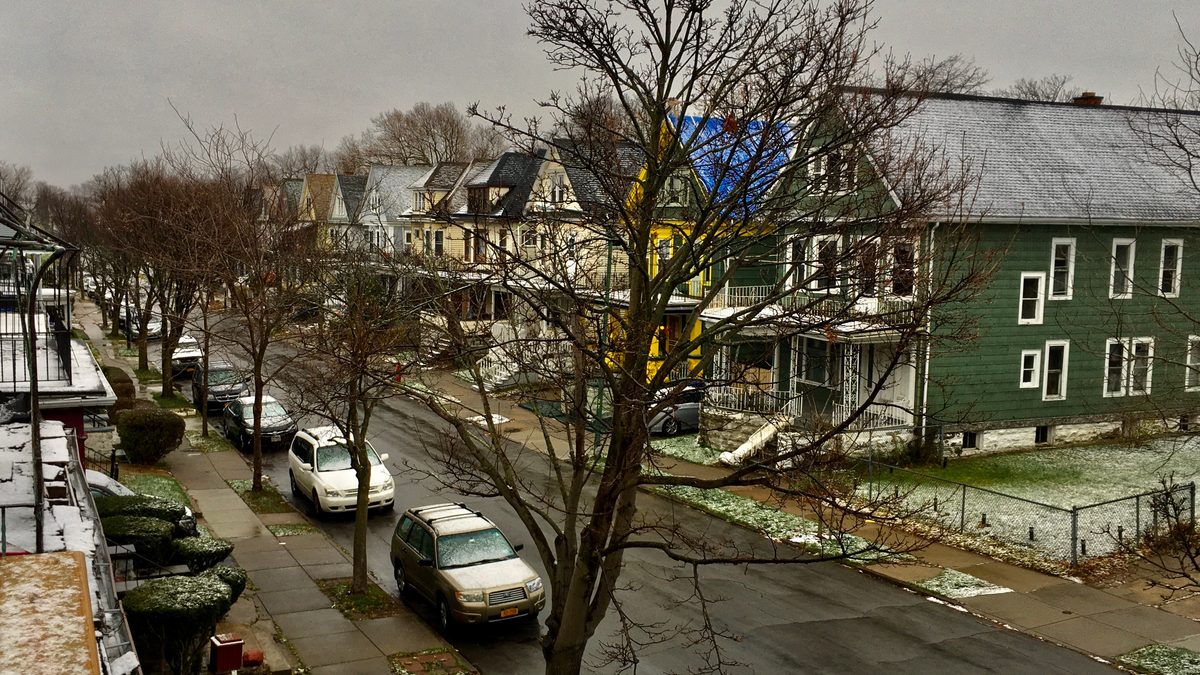
The first measurable snowfall of the 2020-21 winter on Laurel Street, Buffalo, New York, November 22, almost the same calendar date as this year's Thanksgiving. Photo by Andre Carrotflower, CC BY-SA 4.0.
What counts as a white Thanksgiving?
The same standard NOAA uses for a white Christmas: at least 1 inch of snow measured on the ground, or at least 0.1 inch of fresh snowfall, on the holiday itself. It does not need to be snowing at dinner. Old snow still sitting on the ground from an earlier storm counts just as much as snow that fell that morning.
What are the odds of a white Thanksgiving by city?
Anchorage is the only major US city with better-than-even odds, historically. Everywhere else drops off fast: most American cities sit in the 2 to 15 percent range, and dozens cluster near the bottom regardless of region.
White Thanksgiving odds for a geographic spread of US cities, from Action Network's analysis of NOAA daily station data, 1970-2024. | |
City | Odds |
|---|---|
Anchorage, AK | 64.5% |
Fargo, ND | 43.9% |
Minneapolis, MN | 43.6% |
Syracuse, NY | 38.6% |
Salt Lake City, UT | 33.3% |
Spokane, WA | 32.7% |
Buffalo, NY | 31.6% |
Denver, CO | 27.3% |
Milwaukee, WI | 19.3% |
Pittsburgh, PA | 17.5% |
Detroit, MI | 15.8% |
Boise, ID | 14.0% |
Chicago, IL | 12.5% |
Indianapolis, IN | 10.5% |
Boston, MA | 8.8% |
Albuquerque, NM | 7.1% |
Kansas City, MO | 5.5% |
Washington, DC | 5.3% |
Seattle, WA | 4.4% |
New York, NY | 3.5% |
Philadelphia, PA | 3.5% |
Los Angeles, CA | 3.2% |
Phoenix, AZ | 3.0% |
Nashville, TN | 1.8% |
Houston, TX | 1.8% |
Las Vegas, NV | 1.8% |
Tampa, FL | 1.8% |
That bottom cluster is not a rounding error. Action Network applied statistical smoothing so that no city lands at a flat 0%, on the logic that a freak snow event, however unlikely, has not been mathematically ruled out anywhere. Houston, Las Vegas, Tampa and dozens of other warm-climate cities all land at the same floor value, 1.8%, for that reason rather than because they are identical climates.
Advertisement
The full dataset covers 115 US cities. This table picks a geographic spread rather than reprinting all of them; the methodology and full source are linked below.
Why do different sources give different odds for the same city?
Because they are not measuring quite the same thing. Cornell's Northeast Regional Climate Center, a NOAA-affiliated center that publishes its own annual white Thanksgiving map, has put Anchorage as high as 73% using the 1991-2020 normals period. Action Network's 115-city dataset, built from 1970-2024 station data with statistical smoothing applied, puts Anchorage at 64.5%.
Neither number is wrong. They come from different years, different smoothing choices, and in some cases different weather stations for the same city. We are naming the gap instead of picking one figure and presenting it as the single truth, because almost every article on this topic quotes one source's number without saying there is another one that disagrees by nearly 9 points for the same city.
Why does Thanksgiving's moving date matter?
Christmas falls on December 25 every year. Thanksgiving falls on the fourth Thursday of November, which lands anywhere from November 22 to November 28 depending on the year. 2026's Thanksgiving is November 26, nearer the late end of that range.
Late November is still early in the snow season almost everywhere outside the far north, so a six-day swing in the calendar date falls inside a stretch where snow odds are still climbing toward their winter peak. Neither Cornell nor Action Network publishes a breakdown of odds by which calendar date Thanksgiving happens to fall on in a given year, so we are not going to invent a number for how much that swing is worth. The honest version: a later Thanksgiving gives winter a few more days to arrive before the holiday, which should nudge the odds up slightly almost everywhere, not down.
What does this week's forecast talk mean for Thanksgiving 2026?
Two forces are set up against each other this year, and nobody can say yet which one wins. NOAA has a Super El Niño developing, which typically keeps Arctic air bottled up in Canada and limits widespread cold snaps in the Lower 48. At the same time, long-range models are showing a possible polar vortex disruption starting in the second week of November, the earliest such disruption on record if it holds.
FOX Weather's forecast team described it plainly on October 29, 2026: "Trends in the computer modeling will need to be watched closely as they sort out this potentially unprecedented pattern." The outcome decides whether 2026 breaks a real streak. The last Thanksgiving with significant snow cover in more than 20 states was 2019, seven years ago.
Separately, NOAA's Climate Prediction Center flagged a heavy snow risk for November 7-11 in Northern California and the Oregon and Washington Cascades, ahead of a forecast warm spell for the first half of November that should keep most of that snow confined to higher elevations.
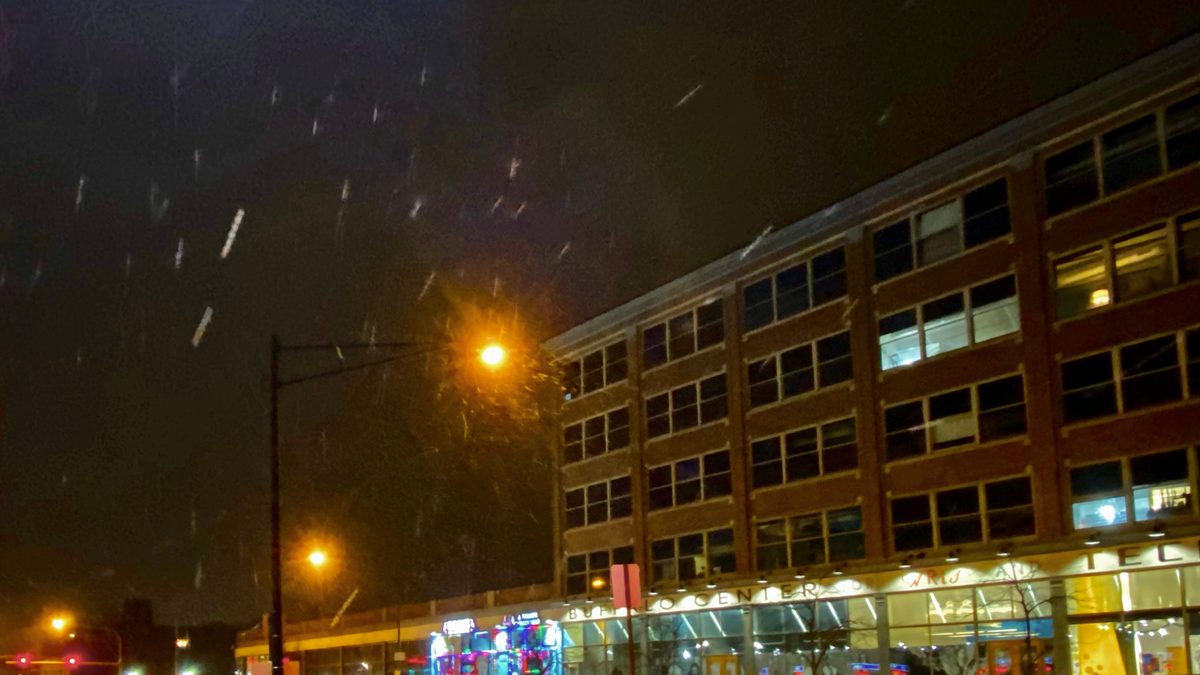
The start of a major lake-effect storm over Main Street, Buffalo, November 2022, forecast at the time to bring two to four feet of snow over several days. Photo by Andre Carrotflower, CC BY-SA 4.0.
None of this is a Thanksgiving Day forecast. A polar vortex disruption beginning in early November does not mean cold air reaches the Lower 48 by November 26, and NOAA's own seasonal outlooks do not predict snow on a specific date more than a week out. We are reporting what the forecast discussion actually says this week, not guessing what it means for one specific Thursday five weeks away.
How do these odds compare to white Christmas?
Christmas odds run noticeably higher almost everywhere, simply because four more weeks of winter have passed. Chicago sits at 12.5% for Thanksgiving against 34% for Christmas. New York City runs 3.5% for Thanksgiving against 13% for Christmas. The gap holds across nearly every city in both datasets.
If snow matters more to your plans than the specific holiday, Christmas is simply the better bet almost everywhere in the country, Anchorage being the one place close enough to call either way.
What this data cannot tell you
Three real limits, stated plainly. The city odds are historical averages, not a forecast. The smoothing method means no city reads as a true zero, even where one may be accurate. And the moving-date question above has no published answer, only a reasoned direction.
Advertisement
This is history, not a forecast for November 26, 2026. Every percentage above describes what happened across 1970-2024 Thanksgivings at that station, nothing about this specific year. This year carries the added wrinkle of the polar vortex and El Niño tug-of-war described above, which the base-rate table cannot capture either way.
Smoothing changes the small numbers. Action Network's Bayesian method was built so that rare, nearly-impossible outcomes still show a nonzero figure, which is honest statistically but means the lowest numbers in the table (1.8% to 3.2%) are a modeled floor shared by many cities rather than each city's own precisely measured history.
This is research, not experience. This guide is built from NOAA station data as analyzed by Action Network and Cornell's Northeast Regional Climate Center, plus this week's published forecast discussion from NOAA's Climate Prediction Center and FOX Weather. Nobody on this team is a meteorologist. For the actual week-of forecast, check the National Weather Service closer to November 26.
Common questions
Will it snow this Thanksgiving, 2026?
Nobody can say that in October, and we are not going to guess. What is known now: a Super El Niño is developing alongside talk of an unusually early polar vortex disruption, a genuine tug-of-war the forecast community is still watching. Check the National Weather Service's 5 to 7 day forecast for your city closer to the holiday.
Which US city has the best odds of a white Thanksgiving?
Anchorage, Alaska, by a wide margin, at 64.5% to 73% depending on the source and years used. No other major US city clears 50%. Fargo and Minneapolis are the next closest, both in the low 40s.
Has it ever snowed on Thanksgiving in New York City?
Occasionally, but rarely enough that the historical odds sit around 3.5%. Upstate New York runs far higher: Buffalo is at 31.6% and Syracuse at 38.6% in the same dataset, which is the same upstate-versus-city split that shows up in white Christmas odds too.
Why is Anchorage so much higher than everywhere else?
Deep early-season snowpack and consistently cold November temperatures, both of which are normal for its latitude well before Thanksgiving arrives. Most of the Lower 48 is still in its early snow season in late November, while Anchorage's winter is already well underway.
Is a polar vortex disruption in November unusual?
Yes. These disruptions typically happen later in winter, not around Thanksgiving. Forecast models showing one beginning in the second week of November would make it the earliest on record if it plays out as modeled, though long-range model signals this far out can still shift.
Does El Niño make a white Thanksgiving more or less likely?
Generally less likely across the Northern Tier and Midwest, since a strong El Niño tends to keep Arctic air bottled up in Canada. That is the typical pattern. This year's early polar vortex talk is the wrinkle working against that tendency, which is why forecasters are calling the outcome a genuine tug-of-war rather than a settled call.
Sources
Action Network, "I'm dreaming of a .... White Thanksgiving?": 115-city dataset built from NOAA daily station data (GHCN-Daily), 1970-2024, with methodology and smoothing approach disclosed. Pulled 31 October 2026.
Cornell Northeast Regional Climate Center, white Thanksgiving probability post (19 November 2021): Anchorage and Northeast regional figures on the 1991-2020 normals period. Pulled 31 October 2026.
FOX Weather, "Last nationwide white Thanksgiving, Super El Niño, polar vortex 2026" (29 October 2026, by Julian Atienza): this year's polar vortex timing, El Niño strength and the 2019 last-widespread-snow fact. Pulled 31 October 2026.
NOAA Climate Prediction Center ENSO Diagnostic Discussion, issued 8 October 2026.
NOAA Climate Prediction Center U.S. Winter Outlook, released 16 October 2026, and its November 7-11 heavy snow risk flag for Northern California and the Cascades, reported 30 October 2026.
Cover and in-body photos: Andre Carrotflower, via Wikimedia Commons, CC BY-SA 4.0.
This page is part of the same winter-holiday cluster as White Christmas Odds 2026 and when to book Thanksgiving flights in 2026, and links up to our USA snow predictions hub.
Topics
Advertisement