Where will it snow this winter? 76 years of US records

NOAA does not forecast seasonal snowfall, so we opened the record: 2,692 station-winters showing what strong El Nino delivered across 36 US cities.
Advertisement
Every year around now the same question starts trending, and every year it gets answered with a map that nobody can actually make. So this is worth saying at the top: where will it snow this winter is not a question anyone can answer for a season ahead, and the agency best placed to try says so in writing.
What we can do instead is open the record. We pulled every month of snowfall from 36 long-record US weather stations back to 1950, summed them into real July-to-June winters, and lined them up against the seven strong El Nino winters of the past 76 years. That is 2,692 station-winters. This page is what they show.
Where will it snow this winter?
Nobody knows, and no honest source will tell you otherwise. NOAA publishes a winter outlook every October covering temperature and precipitation odds, but it deliberately leaves snow out. The useful question is not what a forecast claims, but what winters like the coming one have actually delivered before.
NOAA's own wording is blunt. Its seasonal outlooks give "the likelihood that temperatures and total precipitation amounts will be above-, near- or below-average", and then: "The outlook does not project seasonal snowfall accumulations as snow forecasts are generally not predictable more than a week in advance."
That is the federal agency with the satellites and the supercomputers declining to do the thing every seasonal snow forecast on the internet claims to do. It is the single most useful sentence for a reader planning a winter trip, and almost nobody quotes it.
What is known is the state of the Pacific. On 13 August 2026 the Climate Prediction Center had an El Nino Advisory in force, with a better than 90% chance of a very strong event through the 2026-27 winter, and a 69% chance during October to December of an event above +2.5C, which would make it the strongest since records began in 1950.
So the answerable version of the question is this: when the Pacific has looked like this before, where did the snow actually fall? That has a real answer, and it is not the one most pages give.
Does El Nino mean more snow?
For most of the country, less. Across our 36 stations the seven strong El Nino winters since 1950 came in below each city's own normal in the Northeast, the Mid-Atlantic and the Midwest. The exception is the interior Southwest, where the same winters ran clearly snowier. Direction depends entirely on where you live.
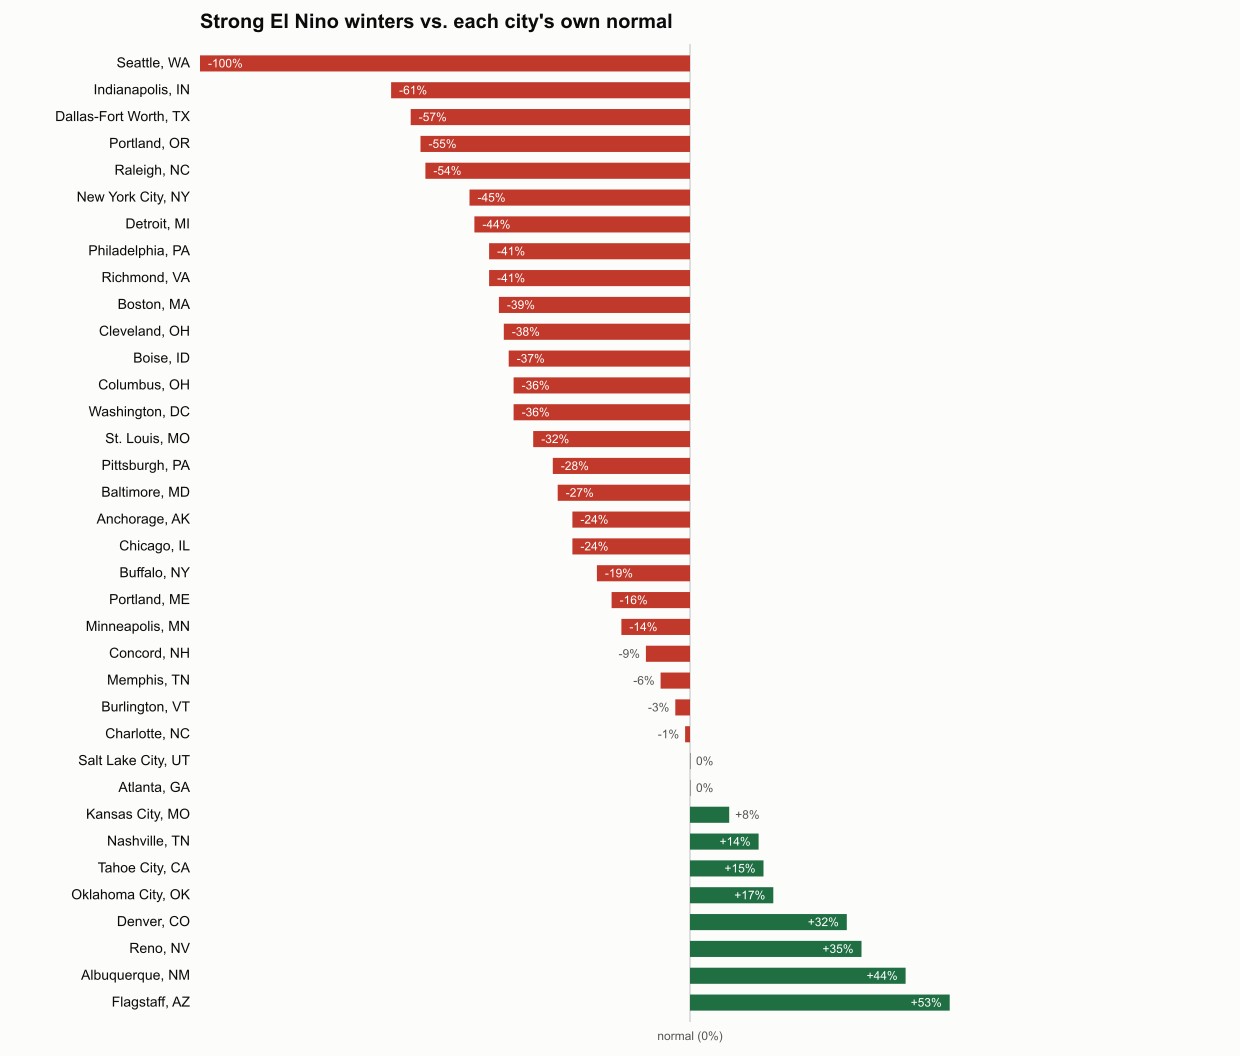
The split is geographic and it is consistent. Taking the median of the per-city change within each region: Mid-Atlantic -36%, Midwest -34%, Northeast -24%, South -1%, West +8%. The southern number hides a lot, because southern cities average so little snow that a two-inch difference swamps the percentage.
Three cities went below their own normal in all seven strong El Nino winters: Indianapolis, Columbus and Pittsburgh. Chicago went below in all six of its complete ones. That is about as close to a rule as this data gets, and it still rests on seven cases.
Does a strong El Nino mean more snow?
Not in the eastern two-thirds of the country. The big eastern snow cities all lost ground: Buffalo fell 19%, Cleveland 38%, Burlington 3%. The places that gained sit in one band through the interior Southwest, led by Flagstaff at +53%, Albuquerque +44%, Reno +35% and Denver +32%.
Here is the fact that should end the argument about El Nino and big snow. The two largest seasonal snowfall totals ever verified in the United States both happened in La Nina winters. Mount Baker Ski Area recorded 1,140 inches in 1998-99, confirmed by NOAA's National Climate Extremes Committee, in a winter with an ONI of -1.51. The previous record, 1,122 inches at Mount Rainier in 1971-72, came in a cool-neutral winter.
Does El Nino mean more or less snow?
Less, on balance, but the balance is thin. Across all 76 winters, a median of 47% of our stations finished below their own normal. In the seven strong El Nino winters that figure was 72%. In every other year it was 46%. The gap is real and it is not large.
The mechanism behind this is well established and it is not about cold. A strong El Nino tends to push the subtropical jet stream north and keep the polar jet displaced, which favours wet storms across the southern tier and a milder, drier pattern over the Ohio Valley and interior Northeast. Snow needs moisture and cold at the same time, and El Nino tends to separate them.
Will it be a snowy winter?
The record says probably below normal for most of the eastern US, and it also says be careful with that sentence. American snowfall has been declining regardless of the Pacific, so some of what looks like an El Nino effect is just the era those winters happened to fall in. Separating the two changes the picture.
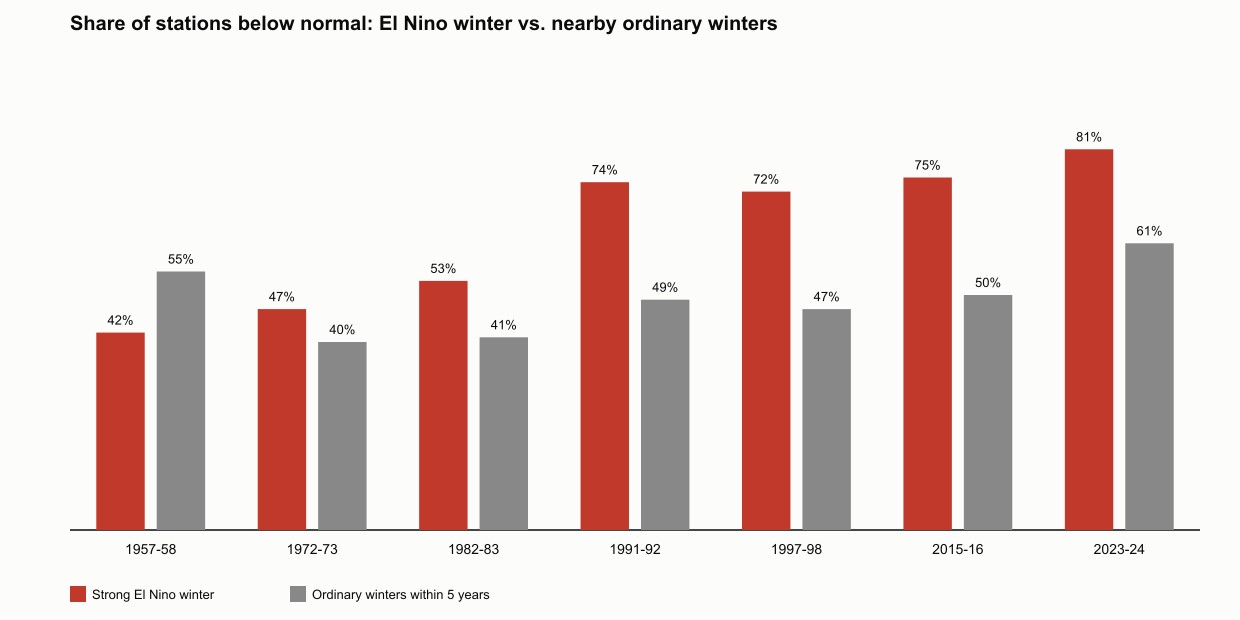
The decline is easy to show. The share of stations finishing below their all-time normal was 42% in 1950-1969, 42.5% in 1970-1989, 49% in 1990-2009 and 58.5% in 2010-2025. Winters have been getting less snowy across the board, El Nino or not.
Against that backdrop, the honest reading of the chart is uncomfortable for a tidy headline. The four most recent strong El Nino winters all ran well below their own decade: 74% against 49%, 72% against 47%, 75% against 50%, 81% against 61%. The three before 1990 show nothing, or the reverse.
| Strong El Nino winter | Peak ONI | Stations below normal | Ordinary winters within 5 years |
|---|---|---|---|
| 1957-58 | +1.7 | 42% | 55% |
| 1972-73 | +1.6 | 47% | 40% |
| 1982-83 | +2.1 | 53% | 41% |
| 1991-92 | +1.5 | 74% | 49% |
| 1997-98 | +2.2 | 72% | 47% |
| 2015-16 | +2.5 | 75% | 50% |
| 2023-24 | +1.8 | 81% | 61% |
We are not going to tell you why the pattern only shows up after 1990. Four events is not enough to separate a genuine shift in the atmosphere from coincidence, and anyone who claims otherwise from seven data points is guessing with a confident voice.
How much snow are we going to get this winter?
Any number you are given for a season ahead is invented. The spread inside El Nino winters is enormous. New York City ranged from 2.8 inches to 44.7 inches across its seven. Boston ranged from 9.8 to 44.7. Same ocean signal, wildly different winters, in the same city.
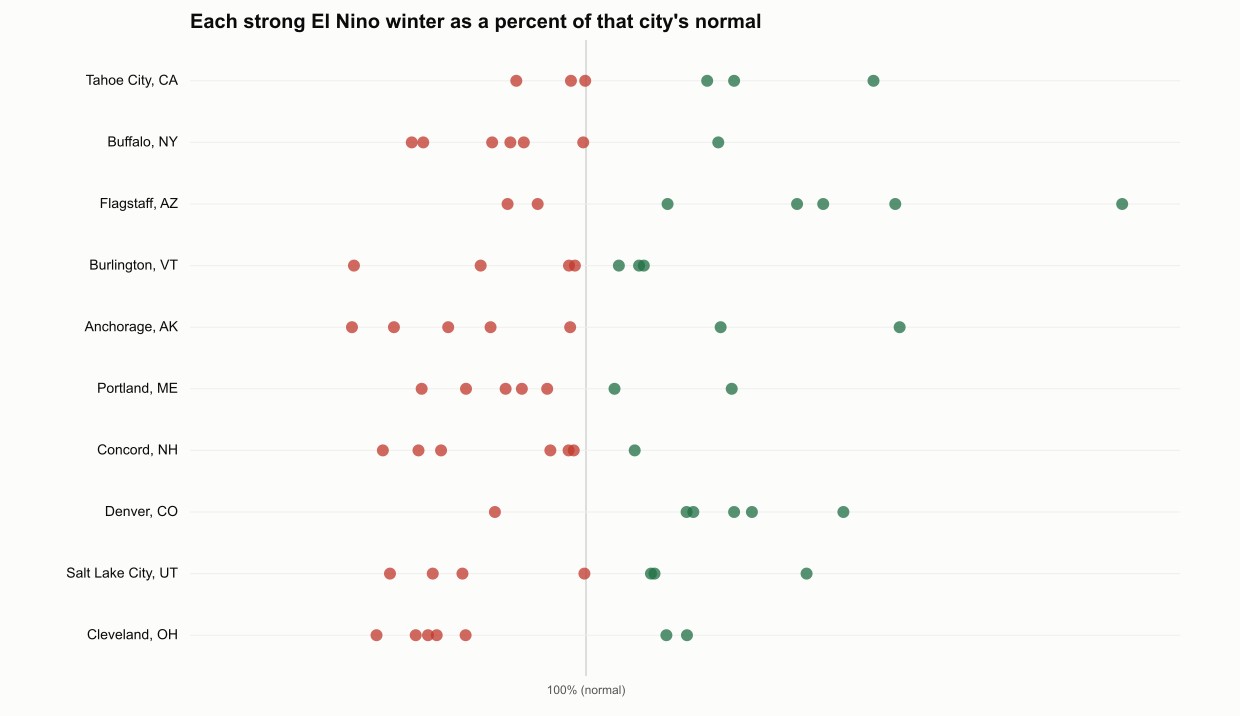
Look at the rows rather than the averages. Eastern cities cluster left of the normal line but almost all of them have at least one El Nino winter that landed above it. Denver and Flagstaff cluster right and still have winters below. A tilt in the odds is not a forecast for your driveway.
Advertisement
This is the honest limit of what a seasonal signal buys you. It is worth something for a ski trip you can book late, or for deciding whether to bother with a February city break to Chicago. It is worth nothing for deciding whether a specific weekend in January will have snow on the ground.
Does El Nino bring more snow to Colorado?
Yes, on the record we have. Denver's normal season is 57.5 inches. Across six complete strong El Nino winters the median was 75.9 inches, about 32% above normal, and only two of the six finished below. The range still ran from 44.6 to 94.9 inches, so the floor is not high.
Denver is a plains station and not a proxy for the ski country west of it, where elevation and orographic lift dominate. Anyone planning around resort snowpack should read our fuller breakdown of the Colorado 2026-2027 snow outlook, which covers the state rather than one airport.
Does El Nino mean more snow in Utah?
No measurable difference at Salt Lake City. The normal season is 56 inches and the strong El Nino median is 55.8 inches, a gap of two tenths of an inch across 76 years. Four of seven finished below normal. Utah sits on the boundary between the wetter south and the drier north, and it shows.
Does El Nino bring more snow to California?
Slightly, at Lake Tahoe, and far less reliably than its reputation suggests. Tahoe City's normal is 170 inches. The strong El Nino median is 195.9 inches, about 15% higher, but three of six landed below normal and the range ran from 140 to 293.5 inches.
The detail worth keeping: 2015-16, the strongest El Nino in the entire record at +2.5, delivered Tahoe City its lowest total of the six at 140 inches. That winter was sold as a drought-breaker for months in advance. If you want one example of why a strong signal is not a promise, that is it.
Does El Nino mean more snow in New England?
Less, and the effect fades as you go north. Boston lost the most at 39% below its normal, with six of seven El Nino winters below the line. Portland, Maine dropped 16%, Concord 9%, and Burlington in northern Vermont only 3%. The coast feels it, the mountains barely do.
That gradient makes sense. Boston's snow depends on coastal storms tracking just right, which the El Nino pattern disrupts, while northern Vermont gets a large share of its total from cold-season events that need less precise setup. Ski-country New England is the least exposed part of the region to this signal.
Does El Nino mean more snow in Michigan?
Less, and Detroit shows one of the clearest declines in the set. Its normal season is 42 inches; the strong El Nino median is 23.5 inches, down 44%, with five of seven below normal. The range across those winters was 18 to 45 inches, so even the best of them only reached normal.
Does El Nino mean more snow in Texas?
No. Dallas-Fort Worth averages 1.2 inches a season, and the strong El Nino median is 0.5 inches. Five of seven winters finished below normal and three recorded nothing at all. The largest was 3.7 inches. Texas snow is a coin flip on individual storms, not a seasonal pattern.
This is the general shape across the South, and it is why percentage changes there mislead. When the normal is one inch, a single event doubles the season. The tables below give inches rather than percentages for exactly that reason.
How cold is this winter going to be in Georgia?
We publish no temperature forecast, and neither should anyone else at this range. On snow, Atlanta's record is flat: a normal of 1.0 inch and a strong El Nino median of 1.0 inch, with three of seven winters below. Its biggest El Nino season was 10.3 inches in 1982-83.
Atlanta's snow is almost entirely a question of whether one storm arrives with cold air behind it. Our Georgia snow page for 2026-2027 goes through the state's actual history. If you are chasing snow rather than waiting for it, driving north into the mountains is a better plan than hoping Atlanta delivers.
Will it snow this winter in North Carolina?
Probably a little, and probably less than usual. Raleigh's normal is 5.3 inches against a strong El Nino median of 2.4 inches, a 54% drop. Charlotte barely moves, at 3.4 inches normal against 3.3. Raleigh's El Nino range ran from zero to 11.8 inches, which is the whole story in one line.
The mountains in the west of the state behave differently from the Piedmont, and our North Carolina winter snow guide separates them properly.
Does El Nino mean more snow in Virginia?
Less. Richmond's normal is 11.3 inches and the strong El Nino median is 6.7 inches, down 41%, with four of seven below. The range ran from 0.7 inches to 29.4 inches. Virginia sits in the part of the Mid-Atlantic where this signal shows up most consistently in our data.
Elevation changes the answer a lot inside the state, and one Richmond gauge cannot speak for the Blue Ridge. Treat this as a reading for the Piedmont and the coastal plain, not for the mountains in the west.
How much snow will Tennessee get this winter?
Tennessee is the one southern state where the El Nino record leans slightly the other way. Nashville's normal is 5.1 inches against a strong El Nino median of 5.8 inches, up 14%, though only three of seven were below normal. Memphis is flat at 3.2 against 3.0 inches.
Both cities have had strong El Nino winters at 11.3 and 7.5 inches, and others near zero. The east-to-west split across Tennessee, from the Cumberland Plateau down to the Mississippi, matters more here than the Pacific does.
How much snow will Maryland get this winter?
Less than normal, if the record holds. Baltimore's normal season is 15.4 inches and the strong El Nino median is 11.3 inches, down 27%, with four of seven below. The spread was extreme even so, from 1.2 inches to 43 inches across those seven winters.
Western Maryland is a different climate entirely. Baltimore sits near sea level, and its figures say nothing useful about the Allegheny country in the far west of the state, which runs on a different scale.
Where does it snow the most in the United States?
Among long-record stations, the mountain West and the Great Lakes snowbelt. Tahoe City, California leads our set with a median 170 inches a season. Buffalo is the snowiest big city at 93.5 inches, ahead of Flagstaff at 89.2 and Burlington at 82.8. Anchorage follows at 74.4.
Advertisement
| Station | Normal season | Strong El Nino median | Change | Biggest season on record |
|---|---|---|---|---|
| Tahoe City, CA | 170.0 in | 195.9 in | +15% | 535.0 in |
| Buffalo, NY | 93.5 in | 75.6 in | -19% | 199.4 in |
| Flagstaff, AZ | 89.2 in | 136.7 in | +53% | 210.0 in |
| Burlington, VT | 82.8 in | 80.5 in | -3% | 145.4 in |
| Anchorage, AK | 74.4 in | 56.5 in | -24% | 134.5 in |
| Portland, ME | 65.0 in | 54.5 in | -16% | 141.5 in |
| Concord, NH | 61.0 in | 55.5 in | -9% | 118.0 in |
| Denver, CO | 57.5 in | 75.9 in | +32% | 99.3 in |
| Salt Lake City, UT | 56.0 in | 55.8 in | 0% | 117.3 in |
| Cleveland, OH | 54.6 in | 34.0 in | -38% | 117.9 in |
| Minneapolis, MN | 48.6 in | 41.7 in | -14% | 98.6 in |
| Detroit, MI | 42.0 in | 23.5 in | -44% | 94.9 in |
| Boston, MA | 41.7 in | 25.6 in | -39% | 110.6 in |
| Pittsburgh, PA | 41.1 in | 29.6 in | -28% | 80.0 in |
| Chicago, IL | 36.1 in | 27.5 in | -24% | 89.7 in |
| Columbus, OH | 26.8 in | 17.1 in | -36% | 56.4 in |
| Indianapolis, IN | 24.2 in | 9.3 in | -61% | 58.2 in |
| New York City, NY | 23.0 in | 12.6 in | -45% | 75.6 in |
| Reno, NV | 22.0 in | 29.8 in | +35% | 59.3 in |
| Philadelphia, PA | 19.1 in | 11.2 in | -41% | 78.7 in |
| Boise, ID | 18.7 in | 11.8 in | -37% | 41.7 in |
| Kansas City, MO | 17.8 in | 19.2 in | +8% | 58.5 in |
| St. Louis, MO | 17.5 in | 11.8 in | -32% | 66.0 in |
| Baltimore, MD | 15.4 in | 11.3 in | -27% | 77.0 in |
| Washington, DC | 12.5 in | 8.0 in | -36% | 56.1 in |
| Richmond, VA | 11.3 in | 6.7 in | -41% | 38.9 in |
| Albuquerque, NM | 8.9 in | 12.7 in | +44% | 37.4 in |
| Seattle, WA | 7.2 in | 0.0 in | -100% | 67.5 in |
| Oklahoma City, OK | 7.0 in | 8.1 in | +17% | 24.4 in |
| Raleigh, NC | 5.3 in | 2.4 in | -54% | 25.8 in |
| Nashville, TN | 5.1 in | 5.8 in | +14% | 38.5 in |
| Charlotte, NC | 3.4 in | 3.3 in | -1% | 22.6 in |
| Memphis, TN | 3.2 in | 3.0 in | -6% | 23.8 in |
| Portland, OR | 3.1 in | 1.4 in | -55% | 34.0 in |
| Dallas-Fort Worth, TX | 1.2 in | 0.5 in | -57% | 17.6 in |
| Atlanta, GA | 1.0 in | 1.0 in | 0% | 10.3 in |
Seattle's -100% needs a word of explanation rather than a headline. Its normal is only 7.2 inches, and in the six strong El Nino winters with complete records the median was zero. Seattle simply stops getting measurable snow in these winters, which is a real finding but a small-numbers one.
Where is the snowiest place in America?
Mount Baker Ski Area in Washington holds the verified record: 1,140 inches in the 1998-99 season, confirmed by NOAA's National Climate Extremes Committee. It beat 1,122 inches recorded at Mount Rainier in 1971-72. Both are mountain observatories rather than towns, and neither is in our station set.
The detail that matters for this page: the 1998-99 record winter had an ONI of -1.51, a strong La Nina, and 1971-72 was cool-neutral. The two snowiest seasons the United States has ever measured happened when the Pacific was doing the opposite of what it is doing now.
What this record cannot tell you
Four limits, stated plainly, because the value of this page depends on them. Everything above is a description of what has already happened at 36 weather stations. None of it is a forecast, none of it is a promise about your town, and the sample behind every El Nino figure is small.
Seven is a small number. Every El Nino figure here rests on seven winters, six for a few stations with gaps. That is enough to see a tilt and nowhere near enough to promise an outcome. Anyone presenting seven cases as a forecast is overselling.
These are city stations, not mountains. Denver is not Colorado ski country, Raleigh is not the Blue Ridge, and Tahoe City is one valley reading rather than the Sierra snowpack. Elevation changes snowfall far more than El Nino does, and our set cannot see that.
The 2026-27 event may be stronger than anything in the sample. If it exceeds +2.5, only 2015-16 is a genuine analogue, and one winter is not a basis for anything. A stronger signal does not simply mean more of the same effect.
We have not chased a storm. Nobody on this site has spent a winter in Buffalo or driven Colorado's passes in January. This is a data page built from the public record, and everything here is checkable in the sources below. For conditions on the ground, your local National Weather Service office is the source, not us.
One more thing worth naming. The two almanacs that publish seasonal snow maps every August do not disclose a testable method, and their forecasts are not verified by any independent body. We compared their claims against the outcome in our look at the almanac forecasts versus what actually happened. Read them for fun, not for planning.
Common questions
Does El Nino bring warm or cold weather?
Broadly milder across the northern US and cooler and wetter across the southern tier, which is the pattern behind the snowfall split on this page. It is a shift in the odds over a season, not a guarantee for any month, and severe cold outbreaks still happen in El Nino winters.
Will it be a snowy winter in Chicago?
The record leans against it. Chicago's normal is 36.1 inches, and in all six complete strong El Nino winters it finished below that, with a median of 27.5 inches. The range was 20 to 32.9 inches, the narrowest of any city here, which is unusual consistency for this dataset.
Will it be a snowy winter in New York?
Probably lighter than normal, with a wide margin of error. New York City's normal is 23 inches against a strong El Nino median of 12.6 inches. Four of seven finished below. The extremes were 2.8 inches and 44.7 inches, so the record supports a lean and nothing firmer.
Does El Nino mean less snow?
For most of the eastern and central US, yes on the balance of seven winters. For the interior Southwest, the opposite. For Salt Lake City, Atlanta and Charlotte, no measurable difference at all. There is no single national answer, which is why most pages that give one are wrong.
When will it snow?
Only a short-range forecast can answer that, and the useful window is about a week. Nothing on this page, and nothing in any seasonal outlook, can tell you the date of a snowfall. For that, check your National Weather Service forecast office in the few days beforehand.
Where does it snow every year?
Thirteen stations here have never once dropped below 15 inches in 76 years: Buffalo, Burlington, Portland in Maine, Concord, Pittsburgh, Chicago, Detroit, Minneapolis, Cleveland, Denver, Flagstaff, Anchorage and Tahoe City. Nine others have had at least one winter with no measurable snow, Philadelphia and Richmond among them.
The full snowless list is Philadelphia, Richmond, Raleigh, Charlotte, Atlanta, Memphis, Dallas-Fort Worth, Seattle and Portland in Oregon. Seven of the nine are in the South or the Mid-Atlantic, and the two Pacific Northwest entries are there because their snow arrives as rain in a mild winter.
Sources
- NOAA Regional Climate Centers, Applied Climate Information System (ACIS). Monthly snowfall for 36 stations, 1950 to 2026, summed into July-to-June seasons. Seasons missing any October-to-May month were dropped, leaving 2,692 station-winters.
- NOAA Climate Prediction Center, Oceanic Nino Index. Winters classified strong El Nino at a December-January-February ONI of +1.5 or above.
- NOAA Climate Prediction Center, ENSO Diagnostic Discussion, 13 August 2026. El Nino Advisory and the probabilities for winter 2026-27.
- NOAA, US Winter Outlook. Source of the statement that the outlook does not project seasonal snowfall accumulations.
- Mt. Baker Ski Area snowfall statistics, for the 1998-99 season total accepted by NOAA's National Climate Extremes Committee.
- Cover photograph by Emanuel Hahn, released CC0 via Wikimedia Commons. Charts produced by Trip Traveling Guide from the ACIS and CPC data above.
Winter travel questions that turn on weather rather than forecasts are collected in our weather for traveling section.
Advertisement