White Christmas Odds 2026: Chances by City and State

NOAA's real odds of a white Christmas by US city and state, from Alaska's 84% to Florida's 0%. Plus how this year's strong El Nino shifts the odds.
Advertisement
A white Christmas means at least 1 inch of snow on the ground at 7am on December 25, by NOAA's own definition. Historically, that happens on more than half of Christmases in the northern tier of states and the western mountains, and on fewer than 1 in 100 across most of the Deep South and Florida. This year adds a twist: NOAA gives a greater than 90% chance of a very strong El Niño, which pushes snow chances up in the western mountains and down across the eastern half of the country in a typical year.
Figures are current as of 26 September 2026. Every odds figure below is a multi-decade historical average, not a forecast for this Christmas.
What actually counts as a "white Christmas"?
The National Oceanic and Atmospheric Administration defines a white Christmas as at least 1 inch of snow measured on the ground at 7am on December 25. It doesn't have to be snowing that morning. Snow that fell days earlier and is still sitting on the ground counts, which is why the odds below are about snow cover, not snowfall.
A separate, rarer thing is fresh snowfall on Christmas Day itself. NOAA's data shows that outside a handful of mountain sites and the snowbelt east of the Great Lakes, the odds of new snow actually falling on December 25 are lower than the odds of snow simply being on the ground already.
What are the odds of a white Christmas by region?
Odds rise as you go north and up in elevation, and fall fast as you head south and toward the coasts. The table below groups weather stations into bands, which is more honest than a single number, since odds vary station to station even within a state.
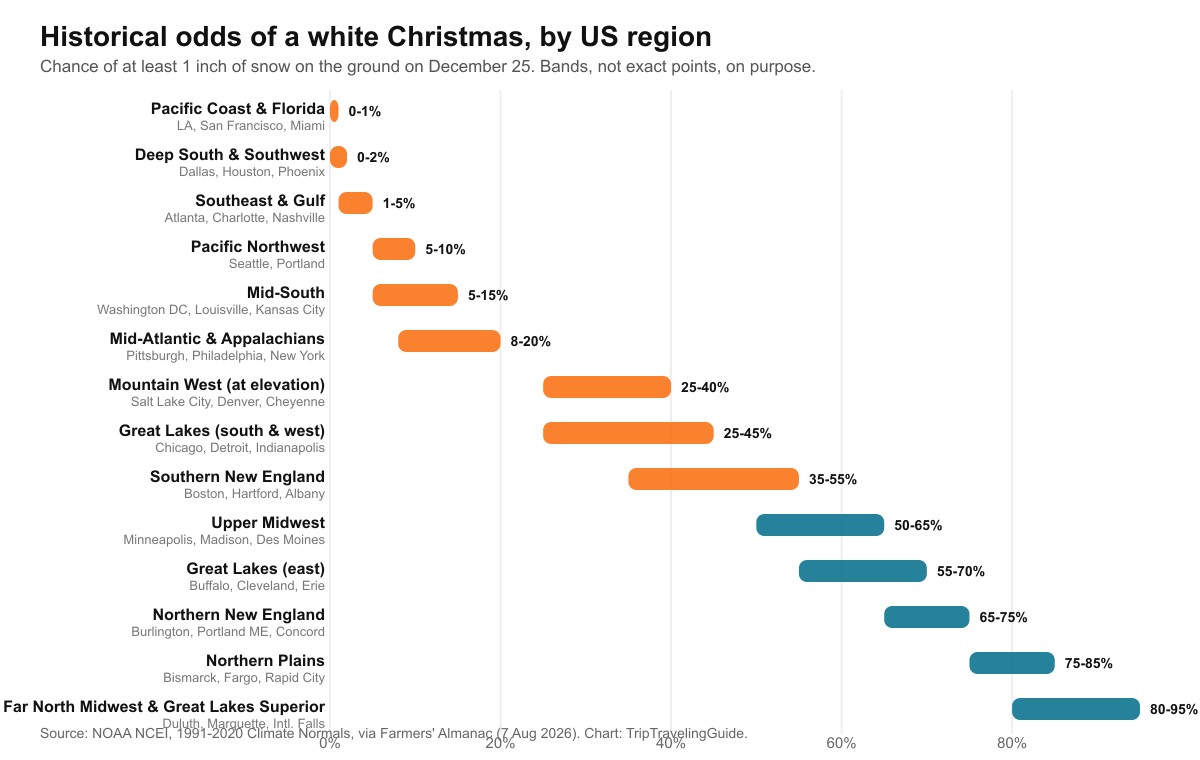
| Region | Example cities | Odds of a white Christmas |
|---|---|---|
| Far north Midwest & Great Lakes Superior | Duluth MN, Marquette MI, International Falls MN | 80 to 95% |
| Northern Plains | Bismarck ND, Fargo ND, Rapid City SD | 75 to 85% |
| Northern New England | Burlington VT, Portland ME, Concord NH | 65 to 75% |
| Great Lakes (east) | Buffalo NY, Cleveland OH, Erie PA | 55 to 70% |
| Upper Midwest | Minneapolis MN, Madison WI, Des Moines IA | 50 to 65% |
| Southern New England & Northeast | Boston MA, Hartford CT, Albany NY | 35 to 55% |
| Great Lakes (south & west) | Chicago IL, Detroit MI, Indianapolis IN | 25 to 45% |
| Mountain West, at elevation | Salt Lake City UT, Denver CO, Cheyenne WY | 25 to 40% |
| Mid-Atlantic & Appalachians | Pittsburgh PA, Philadelphia PA, New York NY | 8 to 20% |
| Mid-South | Washington DC, Louisville KY, Kansas City MO | 5 to 15% |
| Pacific Northwest | Seattle WA, Portland OR | 5 to 10% |
| Southeast & Gulf | Atlanta GA, Charlotte NC, Nashville TN | 1 to 5% |
| Deep South & Southwest | Dallas TX, Houston TX, Phoenix AZ | Under 2% |
| Pacific Coast & Florida | Los Angeles CA, San Francisco CA, Miami FL | Under 1% |
These bands are intentionally wide. A single city sits at one point inside its band, and nearby valleys and hilltops can differ by 10 points or more purely from elevation.
What are the odds of a white Christmas in your state?
Below is every state's average, built from NOAA's full station-level dataset. A state average can hide a lot of local variation, so treat it as a starting point, not the final word for your exact town.
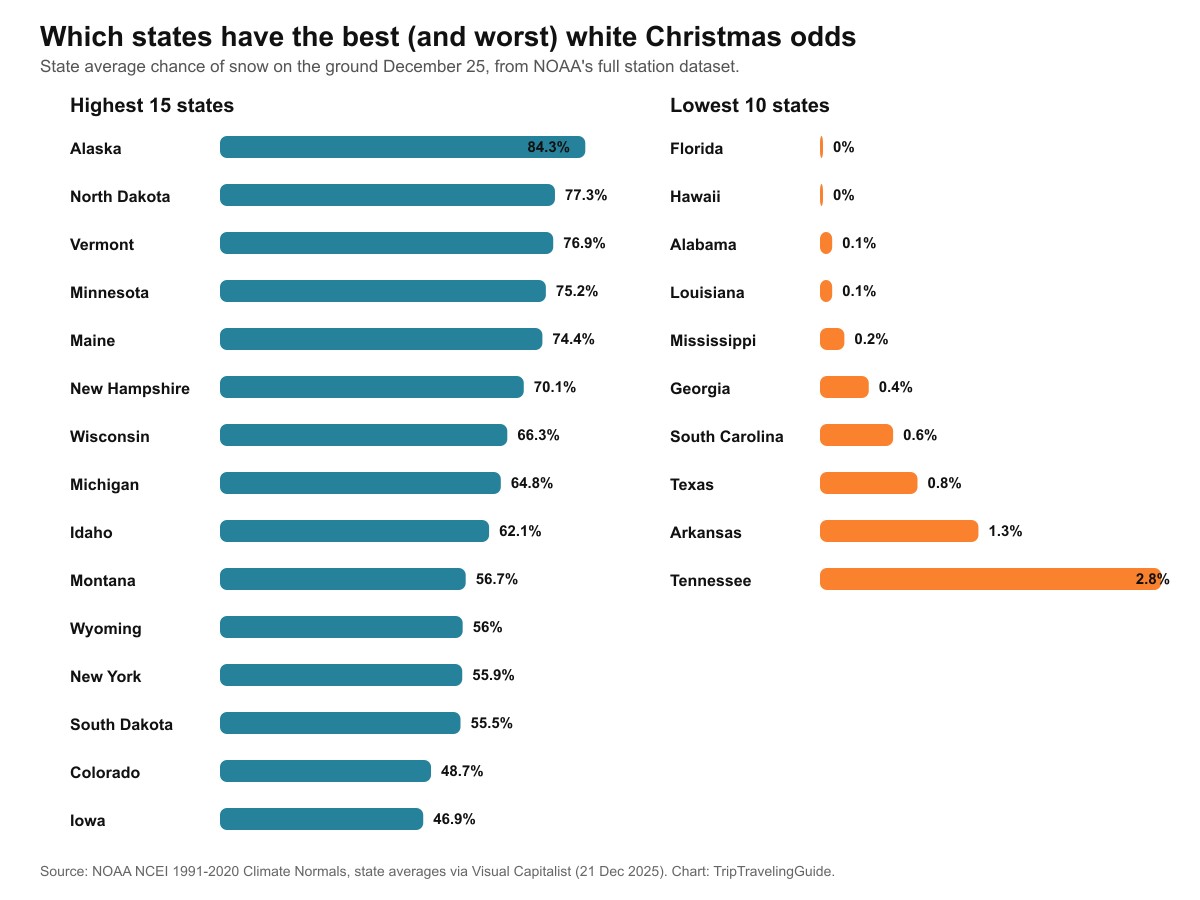
| State | Average odds | State | Average odds |
|---|---|---|---|
| Alabama | 0.1% | Montana | 56.7% |
| Alaska | 84.3% | Nebraska | 35.1% |
| Arizona | 4.1% | Nevada | 17.8% |
| Arkansas | 1.3% | New Hampshire | 70.1% |
| California | 4.4% | New Jersey | 13.7% |
| Colorado | 48.7% | New Mexico | 11.3% |
| Connecticut | 35.2% | New York | 55.9% |
| Delaware | 6.5% | North Carolina | 3.1% |
| Florida | 0.0% | North Dakota | 77.3% |
| Georgia | 0.4% | Ohio | 26.8% |
| Hawaii | 0.0% | Oklahoma | 3.1% |
| Idaho | 62.1% | Oregon | 14.4% |
| Illinois | 27.2% | Pennsylvania | 34.2% |
| Indiana | 26.0% | Rhode Island | 26.9% |
| Iowa | 46.9% | South Carolina | 0.6% |
| Kansas | 15.0% | South Dakota | 55.5% |
| Kentucky | 6.6% | Tennessee | 2.8% |
| Louisiana | 0.1% | Texas | 0.8% |
| Maine | 74.4% | Utah | 46.2% |
| Maryland | 11.2% | Vermont | 76.9% |
| Massachusetts | 35.8% | Virginia | 8.6% |
| Michigan | 64.8% | Washington | 26.9% |
| Minnesota | 75.2% | West Virginia | 26.8% |
| Mississippi | 0.2% | Wisconsin | 66.3% |
| Missouri | 13.7% | Wyoming | 56.0% |
Two states are easy to misread. Pennsylvania averages 34.2%, but that blends the Alleghenies (well above it) with Philadelphia (well below it, near 8 to 20% per the regional table). Washington averages 26.9%, but that blends the Cascades' interior with the coastal Puget Sound area's 5 to 10%.
What are the exact odds for major US cities?
State and regional averages smooth over a lot. Here are point figures NOAA has published for specific major cities, which are more precise than a regional band but still a multi-decade average, not this year's forecast.
Advertisement
| City | Odds of a white Christmas |
|---|---|
| Minneapolis-St. Paul, MN | 74% |
| Cleveland, OH | 39% |
| Detroit, MI | 35% |
| Chicago, IL | 34% |
| Indianapolis, IN | 26% |
| New York, NY | 13% |
New York City's 13% sits well below the New York state average of 55.9% in the state table above. That gap is the entire story of this dataset: Buffalo and the Adirondacks pull the state average up, while the city itself, close to the coast, sits in the Mid-Atlantic band.
How does El Niño change this year's odds?
NOAA's Climate Prediction Center has put a greater than 90% chance on a very strong El Niño developing this winter, with a real chance it becomes the strongest on record since 1950. That shifts where December snow usually falls, though it can't say what happens on one specific day in one specific town.
"In a traditional El Niño pattern, the areas that favor a white Christmas are the higher elevations of the western states," AccuWeather meteorologist Peyton Simmers told Newsweek in September 2026. "December during traditional El Niños is typically warmer than the historical average, yielding a lower-than-historical-average chance for a white Christmas across the eastern United States."
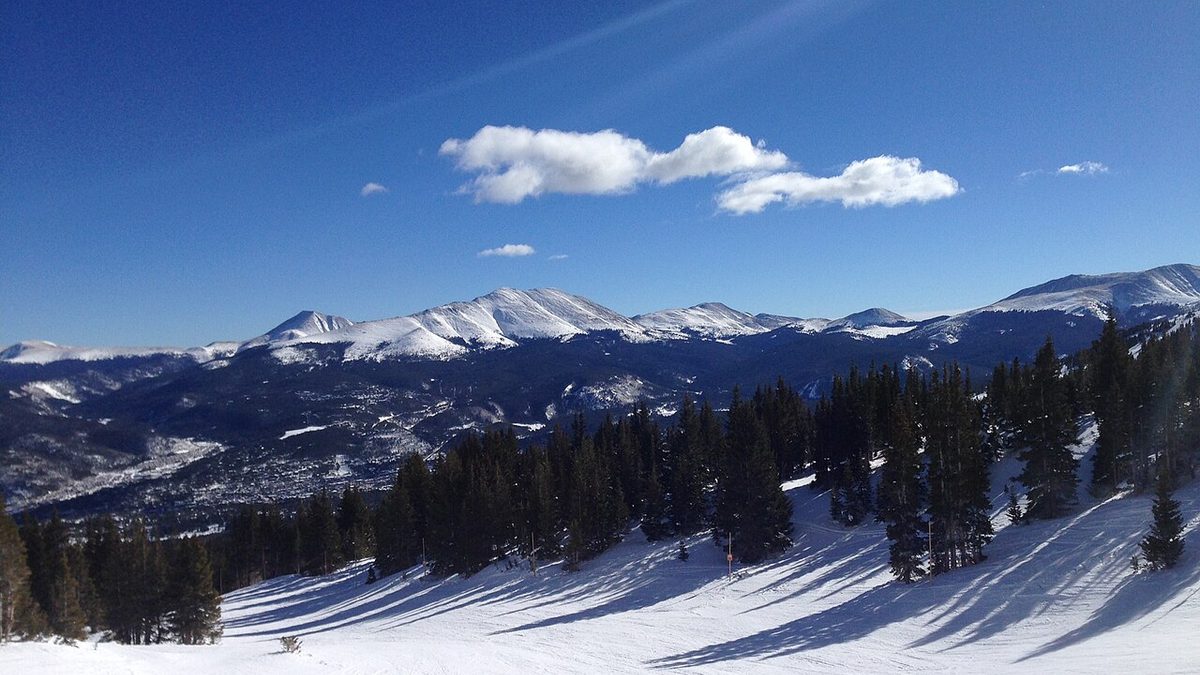
In practice, that means two separate lists this year. States that gain a better-than-usual shot include the high country of Colorado, Utah, Idaho, Nevada, Wyoming, Montana, Oregon, Washington, and elevated parts of Arizona and New Mexico, plus Alaska, which stays a near-lock regardless of the ENSO pattern. States that historically run colder than average in an El Niño winter, and so may see reduced odds versus their long-term average, include Minnesota, North Dakota, Maine, Vermont and New Hampshire.
The Great Lakes states sit in the middle. Wisconsin and Michigan depend heavily on lake-effect snow, which needs cold air moving over open, unfrozen water. A warmer El Niño winter can cut into that setup even where lake-effect snow is usually reliable.
We found no source giving a numeric, city-by-city El Niño adjustment to the odds tables above. The quotes and lists in this section describe direction, not a new percentage, and the National Weather Service had not yet issued its full winter outlook as of this writing.
Are white Christmas odds changing over time, separate from El Niño?
Yes, and this is a slower, separate story from any single winter's ENSO pattern. Colin Zarzycki, an atmospheric scientist at Penn State University, told Scientific American that the window of temperatures cold enough for snow is narrowing as the planet warms, and the first snow of the season is arriving later than it used to across the US.
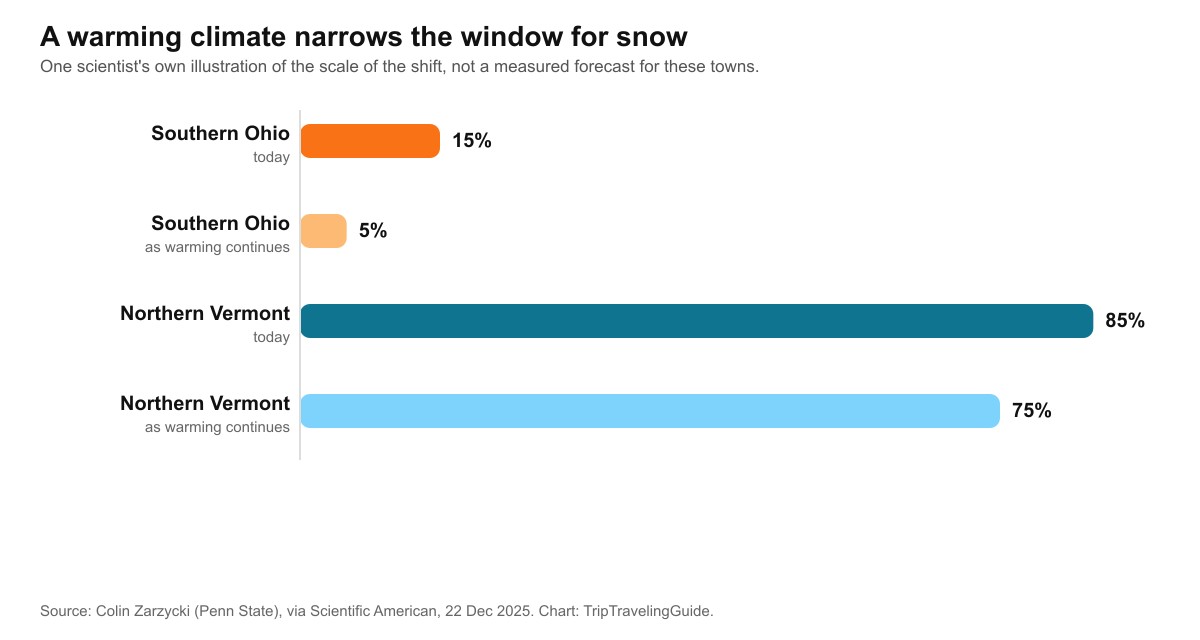
"If stuff's going to fall out of the sky on December 24, if it's warmer, it's more likely to fall as rain," Zarzycki said. As an illustration of the scale, he described a place like southern Ohio going from roughly a 15% chance of snow to roughly 5%, while northern Vermont's 85% might ease to something nearer 75%. Those are his own examples of the kind of shift involved, not our figures or a claim about this specific Christmas.
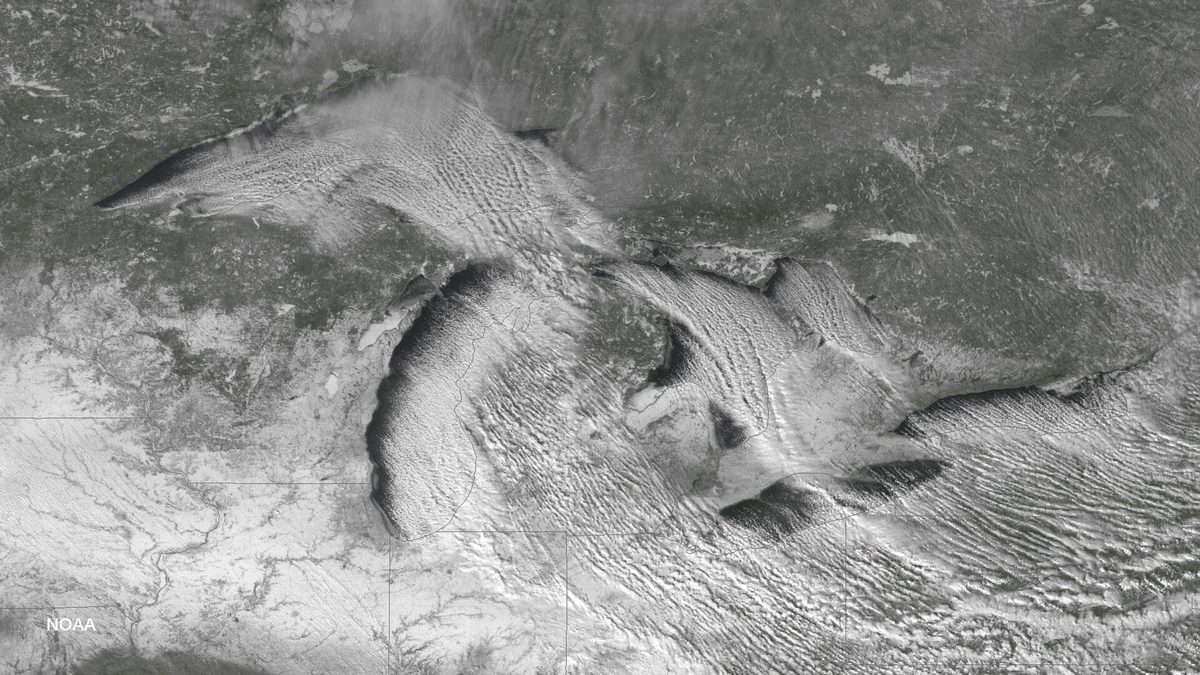
One place bucks the trend, at least for now. Lake-effect snow needs cold air blowing over open water, and warming lakes are taking longer to freeze over each winter. That gives areas downwind of the Great Lakes a stretch where lake-effect snow can actually run heavier than it used to, even as the total number of snowy days falls elsewhere.
There's a second wrinkle worth knowing before you read any single year's headline. Warmer air holds more moisture, so on the days that are still cold enough for snow, the storms that do arrive can drop more of it. Zarzycki's read on the observed pattern in the northern US and southern Canada: a season might lose 40% of its snow-capable days, while total seasonal snowfall drops by only around 20%, because the remaining storms hit harder.
What happened last Christmas, in 2025?
Christmas 2025 was a below-average year for snow cover. Only about 26% of the Lower 48 states had snow on the ground, mostly in the Midwest, mountain West, upstate New York and northern New England. A pre-holiday thaw had melted snow that fell earlier in December across the Midwest and mid-Atlantic.
That's a reminder built into the odds themselves: even a place with a 50% historical chance is, by definition, going to miss half the time. One quiet year doesn't mean the underlying odds have changed.
Does it need to be snowing on Christmas Day itself?
No, and this trips people up. NOAA's white Christmas is about snow already on the ground at 7am, not snow actively falling. A town can have a foot of week-old snowpack, clear skies, and sunshine on December 25 and still count as a white Christmas by the official definition.
Fresh snowfall on the day itself is the rarer event. Outside isolated mountain sites, the lee shores of Lakes Superior and Ontario, and northern New England, the odds of new snow falling on December 25 stay under 50% almost everywhere, even in places where snow cover is a near-certainty.
Why do the north and the mountains have such better odds?
Two things decide the odds at any spot: how cold late December typically runs, and how much snow has already built up by the 25th. Northern latitudes get less sunlight and colder air, so early snow doesn't melt. Elevation does the same job, since temperature drops roughly 3 to 5°F per 1,000 feet, which is why Denver outscores towns at the same latitude but sea level.
The Great Lakes add a third factor. Cold air crossing the lakes' open water in early winter picks up moisture and drops it as lake-effect snow downwind. That's why Buffalo and Erie score well above other cities at a similar latitude that sit away from the lakes.
Planning holiday travel around the odds?
If you want snow for the holiday, the region table above says the far northern Midwest, northern New England and the high Rockies give you the best odds without leaving the continental US. If you'd rather avoid winter weather delays at the airport, the Southeast, Texas and the Pacific Coast carry the lowest odds of any snow-related disruption on the day itself.
Advertisement
Either way, book early. Our guide to when to book Christmas flights in 2026 has the exact price windows, and our guide on what you're owed if snow cancels your flight covers the refund rules if a storm does hit your route.
What are the limits of this data?
Every odds figure here is a historical average from the 1991 to 2020 Climate Normals, not a prediction for December 25, 2026. NOAA itself says actual conditions in any single year can vary widely from these odds, because the weather pattern in the two weeks before the holiday decides how much snow is actually on the ground.
State and regional averages blend many stations together and can hide real local differences, which the Pennsylvania and Washington examples above show directly. The El Niño section describes an expected shift in direction, sourced to NOAA's ENSO outlook and one meteorologist's characterization of typical El Niño winters, not a numeric update to the odds tables. We found no single, verified list of exact snow-on-the-ground outcomes for every city on December 25, 2025, so our recap of last year is limited to the national figure and the regions named in national reporting. The climate-trend figures in the section above are one scientist's illustrative examples of scale, not measured probabilities for those two towns.
You'll see other sites publish a flat "yes" or "no" call for a specific region this Christmas, months ahead of the date. We don't, because nobody has that information in September. If you want a number specific to your own town rather than a regional band, your local National Weather Service office often publishes station-level historical odds, similar to the example we cite in the sources below.
Quick answers about white Christmas odds
What is the official definition of a white Christmas?
NOAA defines it as at least 1 inch of snow measured on the ground at 7am on December 25. It doesn't need to be snowing that morning, and snow that fell earlier and stuck around counts.
Does it usually snow on Christmas in New York?
Rarely in New York City itself, where the historical odds sit around 13%. Upstate New York is a different story: Buffalo and the Great Lakes snowbelt run 55 to 70%, which is why the statewide average lands near 56%.
Does it usually snow on Christmas in Chicago?
About 34% of the time, historically, per NOAA's data on snow already on the ground at Christmas morning. That's a Great Lakes (south and west) city, in the same band as Detroit and Indianapolis.
Which US cities have the best chance of a white Christmas?
Duluth, Marquette and International Falls lead at 80 to 95%, with Bismarck, Fargo and Rapid City close behind at 75 to 85%. Minneapolis-St. Paul specifically sits at 74%, one of the highest odds among major metro areas.
Will it snow on Christmas 2026?
Nobody can say that in September, and we're not going to guess. What's known now is the historical odds by place, above, and this year's El Niño outlook, which favors the western mountains over the eastern half of the country. The National Weather Service's full winter outlook was not yet published as of this writing.
Are white Christmas odds getting lower because of climate change?
Yes, gradually, in most places. Penn State atmospheric scientist Colin Zarzycki says the temperature window cold enough for snow is narrowing as the planet warms, so the odds drift down over decades. It's a slow trend, separate from any single year's El Niño swing, and areas near the Great Lakes are a partial exception.
What are the chances of a white Christmas in Boston, Pittsburgh or Denver?
Boston sits in the Southern New England band at 35 to 55%. Pittsburgh sits in the Mid-Atlantic and Appalachians band at 8 to 20%. Denver sits in the Mountain West band at 25 to 40%, and this year's El Niño outlook favors elevated western spots like Denver more than usual.
How often is there a white Christmas overall in the US?
There's no single national percentage, because the odds vary from under 1% in Florida to over 90% in parts of Alaska and the northern Rockies. National recaps like 2025's "26% of the Lower 48 had snow on the ground" describe one specific year, not a long-run average.
Sources
- NOAA National Centers for Environmental Information, "Are You Dreaming of a White Christmas?": official definition, 1991-2020 Climate Normals, data period and issue date (May 2021). Accessed 26 September 2026.
- Farmers' Almanac, "White Christmas Odds 2026: What Are Your Chances Of Snow?" (updated 7 August 2026): regional odds bands and representative cities, drawn from NOAA/NCEI data and the Bulletin of the American Meteorological Society. Accessed 26 September 2026.
- Visual Capitalist, "Mapped: Chances of a White Christmas Across the U.S." (21 December 2025, by Niccolo Conte): full 50-state average table, from NOAA NCEI's 5,000-plus station dataset. Accessed 26 September 2026.
- CBS News, "What are the chances of a white Christmas where you live?" (22 December 2025, by Taylor Johnston): specific city percentages for Minneapolis-St. Paul, Cleveland, Detroit, Chicago, Indianapolis and New York City. Accessed 26 September 2026.
- Newsweek, "El Niño White Christmas Map Shows Snow Impact for Every State" (8 September 2026, by Anna Skinner): NOAA's El Niño outlook and AccuWeather meteorologist Peyton Simmers' comment on regional impact. Accessed 26 September 2026.
- Weather.com, White Christmas 2025 recap: the 26% national snow-cover figure and the regions that had snow on Christmas 2025. Accessed 26 September 2026.
- Scientific American, "Will There Be a White Christmas This Year? It Depends on Where You Live" (22 December 2025, by Andrea Thompson): Penn State atmospheric scientist Colin Zarzycki on the long-term warming trend, the Ohio/Vermont illustration, and the lake-effect exception. Accessed 26 September 2026.
- National Weather Service, Quad Cities office, "Probability of a White Christmas": an example of the station-by-station detail your local NWS office may publish beyond the national map. Accessed 26 September 2026.
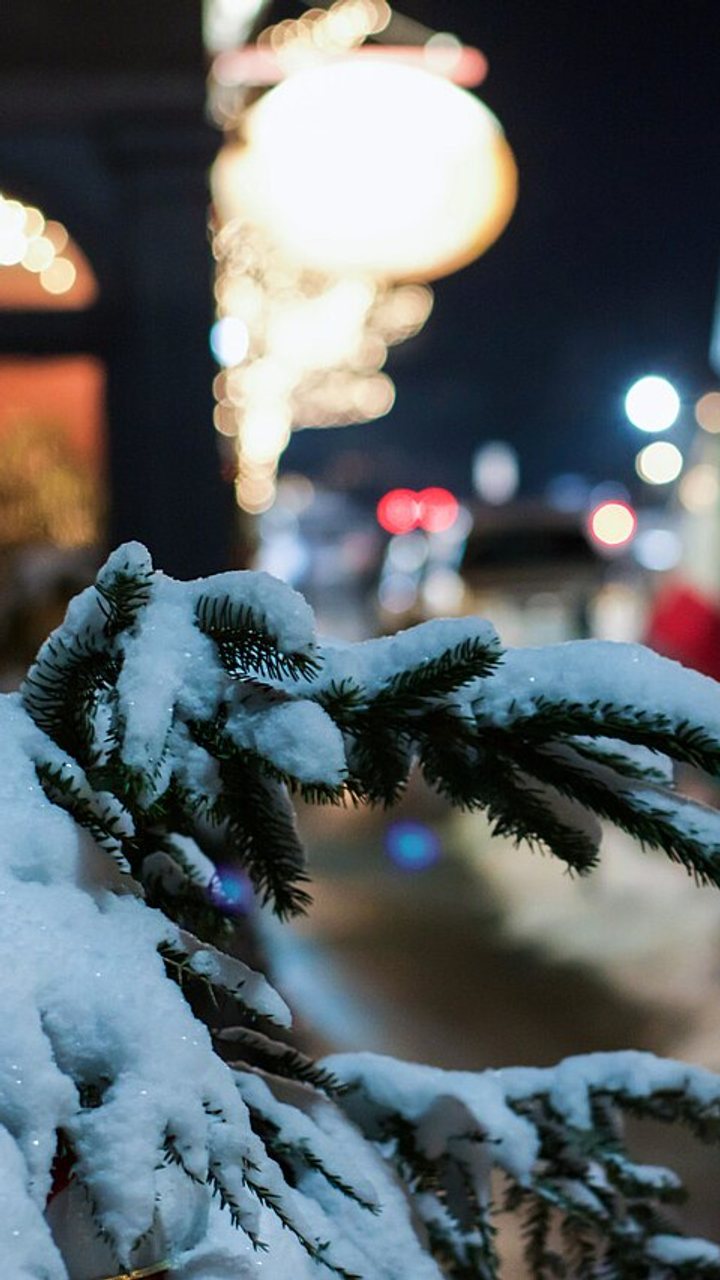
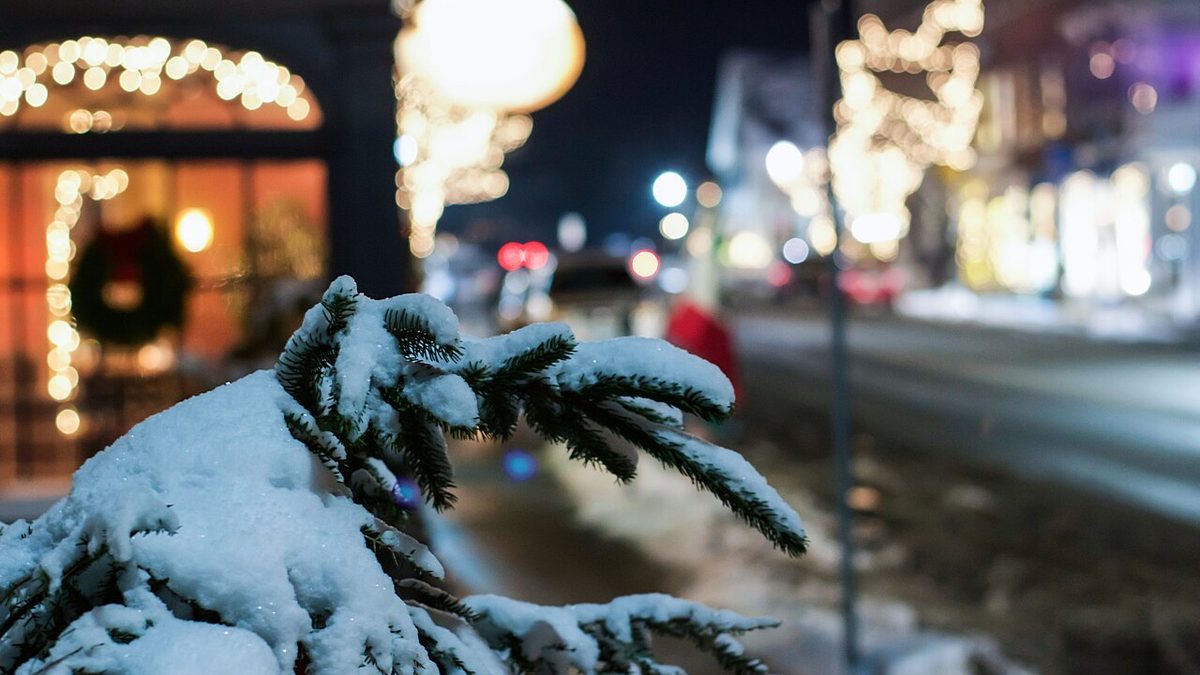
- Cover photo: snow-covered branch and Christmas lights on Main Street, Woodstock, Vermont, 23 December 2016, by Jesse Collins, CC BY 3.0, via Wikimedia Commons.
- Mountain photo: view from a ski slope near Breckenridge, Colorado, by Jlfdz, CC BY-SA 4.0, via Wikimedia Commons.
- Lake-effect satellite image: NOAA GOES East, 7 January 2015, public domain, via Wikimedia Commons.
Topics
Advertisement