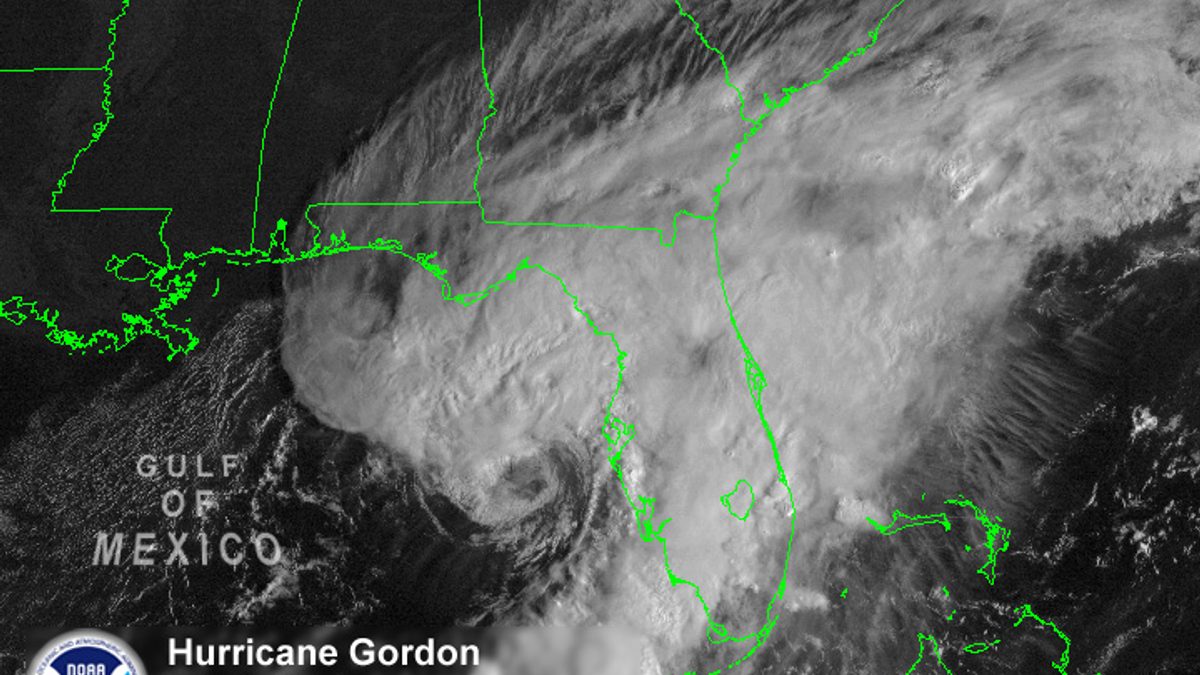
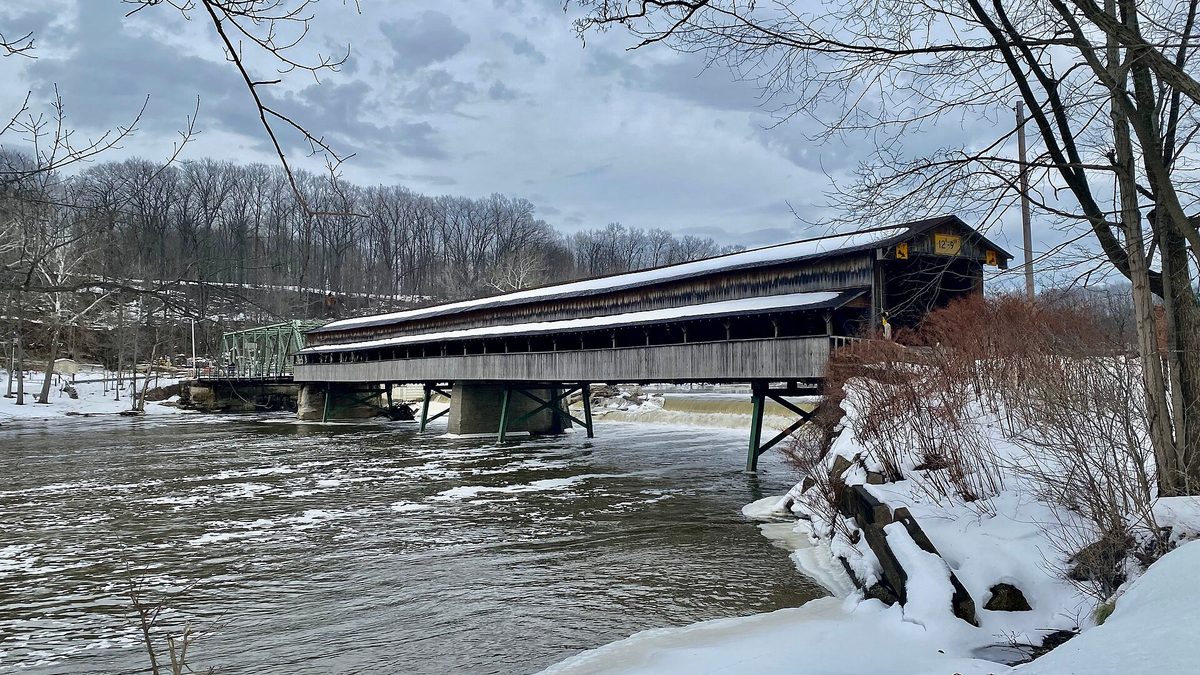
Snow Predictions for Ohio 2026-2027

NOAA expects a very strong El Nino. In Ohio's 7 strong El Nino winters all nine stations fell below normal, but Mansfield lost 46 percent and Cincinnati 29.
Advertisement
Ohio is not one winter. It is at least three, and the gap between them is wider than anything a seasonal forecast is arguing about. This guide puts the 2026-2027 outlooks next to 77 years of daily snowfall records from nine Ohio weather stations, so you can see what is being predicted and what the state actually does.
Will it snow in Ohio this winter?
Yes. Every part of Ohio gets measurable snow every winter, and the only real question is how much. Cincinnati averages 23.3 inches a season and Chardon, in Geauga County, averages 113.7. NOAA has declared an El Nino advisory, which historically cuts Ohio snowfall at every station we checked.
That last point is the one worth sitting with. We rebuilt every Ohio snow season since 1949 from daily station values and compared them against the official ocean index NOAA uses to classify El Nino. Averaged across the seven strongest El Nino winters on record, all nine Ohio stations came in below their own long-run mean. Not most of them. All nine. Individual seasons still broke the pattern, and those are shown further down rather than buried.
What that does not tell you is how much less, or where. The answer to that turns out to be surprising, and it is not the answer most winter articles give.
How much snow does Ohio normally get?
It depends enormously on where you stand. The official 1991-2020 seasonal normals run from 113.7 inches at Chardon down to 23.3 inches at Cincinnati, a factor of nearly five across a single state. Northeast Ohio is one of the snowiest places east of the Rockies. Southwest Ohio is not.
These are the NOAA National Centers for Environmental Information 1991-2020 climate normals, the standard 30-year baseline. The long-run mean column beside them is our own figure, built from every usable season in the daily record, and it is there so you can see whether the recent 30 years look unusual against the longer history.
| Station | Region | 1991-2020 normal | Long-run mean | Seasons used |
|---|---|---|---|---|
| Chardon (Geauga County) | Snowbelt ridge | 113.7" | 104.9" | 69 |
| Youngstown | Northeast Ohio | 67.8" | 60.3" | 76 |
| Cleveland | Lake Erie shore | 63.8" | 57.8" | 77 |
| Mansfield | North central | 49.2" | 42.1" | 73 |
| Akron-Canton | Northeast Ohio | 47.2" | 46.6" | 77 |
| Toledo | Northwest Ohio | 37.4" | 35.5" | 71 |
| Columbus | Central Ohio | 28.2" | 27.5" | 77 |
| Dayton | Southwest Ohio | 25.0" | 27.2" | 75 |
| Cincinnati | Ohio Valley | 23.3" | 23.5" | 76 |
Cleveland and the Lake Erie snowbelt
Cleveland Hopkins airport normals 63.8 inches, but the airport sits on the west side of the city and misses most of the lake effect. Thirty-six miles east and 353 feet higher, Chardon normals 113.7 inches. Same metropolitan area, nearly double the snow, and the difference is almost entirely lake effect.
Columbus and central Ohio
Columbus normals 28.2 inches a season, and its snow arrives in fewer, larger events rather than the steady drizzle of flakes the northeast gets. In a median winter Columbus records eight days with an inch or more, against 32 such days at Chardon. Its snowiest season on record is 56.4 inches.
Cincinnati and the Ohio Valley
Cincinnati is the mildest of the nine, normalling 23.3 inches, and in a median winter it sees just seven days with an inch or more of snow. Its record low season is 5.6 inches in 2011-12. Its record high is 53.9 inches in 1977-78, more than double its own normal.
Toledo, Akron, Dayton and Youngstown
These four fill in the middle of the range. Youngstown normals 67.8 inches and is the snowiest first-order airport in the state. Akron-Canton normals 47.2, Toledo 37.4 and Dayton 25.0. Toledo sits on Lake Erie but at the wrong end of it, which is why it normals 59 percent of Cleveland's total.
What is the Ohio snowbelt and why does it get so much more?
The snowbelt is the strip of high ground east and southeast of Cleveland where cold air crossing warm Lake Erie picks up moisture and dumps it on rising terrain. Lake, Geauga, Ashtabula and eastern Cuyahoga counties form the core of it. The mechanism needs open water, cold air and elevation together.
Two of those three ingredients explain why the snowbelt starts and stops so abruptly. Chardon sits at 1,130 feet. Cleveland Hopkins sits at 777 feet and 36 miles further west, upwind of the fetch. That 353-foot difference and the extra water the wind crosses is worth roughly 50 inches a season.
The third ingredient is the one that changes from year to year. Lake effect needs Lake Erie to stay unfrozen, because ice cover shuts the moisture supply off. Erie is the shallowest of the Great Lakes and freezes more readily than the others, so a cold December can, counter-intuitively, reduce February snowfall by capping the lake. NOAA's Great Lakes ice cover records track this directly.
The National Weather Service office in Cleveland describes normals in the snowbelt counties as running from 70 to over 100 inches, which matches our Chardon figure and not the lower numbers circulating on some weather aggregator sites.
Why do published figures for Chardon disagree so badly?
Because different sources are quoting different stations and not saying so. One widely copied aggregator lists Chardon at 47.5 inches. Ohio State University published 106 inches for 1945-85. The National Weather Service says 70 to over 100. Our own pull of the NOAA record returns 113.7.
We checked which station is which rather than picking the number that suited the story. The Chardon record we used is NOAA station USC00331458, at 41.587 North and 81.191 West, elevation 1,130 feet, with a daily record running from 1 June 1945 to 27 August 2026. It is the only long-record snowfall station in Geauga County, so there is no second Chardon to confuse it with.
Its raw monthly values back the total up. January 2026 alone measured 56.8 inches at that station, which is more than a full season at Columbus. Ohio State's 106 inches for 1945-85 sits within a fraction of our own 104.9 inch long-run mean, and the Weather Service band contains both. Three sources agree. The 47.5 inch figure is the outlier, and anything built on it understates northeast Ohio badly.
What do the last five winters actually show in Ohio?
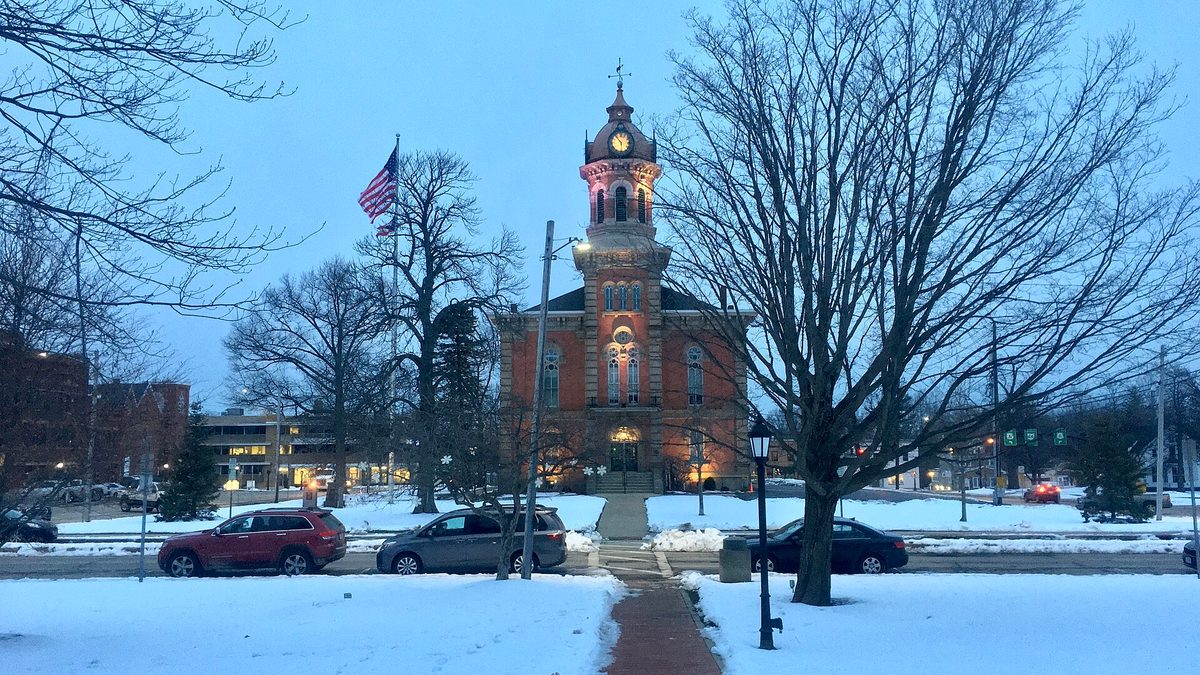
The last five Ohio winters show volatility rather than a trend. Cleveland ran 53.0 inches in 2021-22, collapsed to 22.7 the next year, and recovered to 50.9 last winter. Cincinnati went from 7.8 inches in 2023-24 to 32.6 in 2025-26. The ocean index for each season sits in the bottom row.
| Station | 2021-22 | 2022-23 | 2023-24 | 2024-25 | 2025-26 |
|---|---|---|---|---|---|
| Chardon | 94.9" | 59.4" | 39.9" | 97.4" | 117.3" |
| Youngstown | 60.8" | 22.8" | 29.5" | 43.5" | 55.0" |
| Cleveland | 53.0" | 22.7" | 25.7" | 34.7" | 50.9" |
| Akron-Canton | 52.0" | 21.3" | 15.0" | 34.9" | 48.5" |
| Mansfield | 26.6" | 14.5" | 8.4" | 15.1" | 29.6" |
| Toledo | 30.8" | 14.3" | 9.6" | 12.9" | 29.2" |
| Columbus | 14.5" | 12.5" | 12.6" | 14.8" | 33.9" |
| Dayton | 16.5" | 17.3" | 13.6" | 21.9" | 38.7" |
| Cincinnati | 13.3" | 14.4" | 7.8" | 29.3" | 32.6" |
| Ocean index (ONI, DJF) | -0.76 | -0.55 | +1.84 | -0.46 | -0.39 |
The middle column is the one to look at. 2023-24 was the last El Nino winter, and it produced the lowest season ever recorded at four of these nine stations. The other four winters in that table were all weak La Nina or neutral seasons.
The pattern is not clean, though, and the table shows why. Chardon, Akron-Canton, Mansfield and Toledo all beat 2023-24 in every other winter listed. Cleveland and Youngstown did not: both had a worse season in 2022-23, at 22.7 and 22.8 inches, than they had in the El Nino year that followed. One winter is never enough to see a pattern with.
What is NOAA saying about winter 2026-2027?
NOAA's Climate Prediction Center has an El Nino advisory in force, issued in its ENSO diagnostic discussion of 13 August 2026, with better than a 90 percent chance the event reaches very strong status this winter. Sea surface anomalies in the eastern equatorial Pacific are already running above plus 2.0 degrees.
The ENSO diagnostic discussion put the July Nino-3.4 index at plus 1.4 degrees, and its next issue is dated 10 September 2026. The official ONI record gives plus 1.39 for the most recent completed season.
The centre's seasonal prognostic discussion of 20 August 2026 forecasts a slight tilt toward below-normal precipitation across much of the Great Lakes. For the Ohio Valley it gives equal chances, and says plainly that historical analogues to this El Nino do not support a strong dry signal there. The state is split across those two calls.
Advertisement
One thing NOAA has not done yet is issue its actual winter outlook. Its 90-day outlooks are released once a month near mid-month, which puts the first real 2026-2027 winter map in mid-October. Anyone publishing a NOAA winter snowfall map for Ohio in August is showing you either last year's map or something NOAA did not produce.
What do the Farmers Almanac and the Old Farmers Almanac say?
The two almanacs use different methods and for Ohio they do not agree with each other. The Farmers Almanac 2026-2027 forecast, published 6 August and updated 21 August 2026, carries a section headed Great Lakes, Ohio Valley and Midwest.
Its wording for that zone rewards a close read, because near normal does not mean quiet. It expects temperatures to average near normal, then says directly that this does not mean winter will be mild, and describes fast-moving clippers, sudden cold snaps, brief snowy periods, snow squalls and bursts of bitter cold. That is a variable winter, not a soft one.
The Old Farmers Almanac, updated 29 August 2026, splits Ohio down the middle and gives the two halves opposite forecasts. Neither publication gives a snowfall figure in inches for any Ohio city, and neither publishes an independently audited accuracy record, which is worth knowing before either is treated as a number.
Where the forecasts disagree with each other
The sharpest disagreement is inside a single publication. The Old Farmers Almanac puts northern Ohio in its Lower Lakes region and southern Ohio in its Ohio Valley region, then calls one warmer than normal and the other colder than normal. The state line between them runs through the middle of Ohio.
| Forecast | Area covering Ohio | Temperature | Snowfall | Coldest or snowiest window |
|---|---|---|---|---|
| Old Farmers Almanac | Lower Lakes (northern Ohio) | Above normal | Near to below normal | Early and late January, early February |
| Old Farmers Almanac | Ohio Valley (southern Ohio) | Below normal | Slightly below normal | Mid and late January, mid February, early March |
| Farmers Almanac | Great Lakes, Ohio Valley and Midwest | Near normal | No figure given | Not specified |
| NOAA CPC, 20 Aug 2026 | Great Lakes | Warm lean | Slight tilt to below-normal precipitation | Winter outlook not yet issued |
| NOAA CPC, 20 Aug 2026 | Ohio Valley | Weak warm lean | Equal chances | Winter outlook not yet issued |
What they do agree on is snow, loosely. Both almanacs land somewhere at or below normal, and NOAA's precipitation tilt points the same way for the northern half. None of those is a snowfall total, and precipitation is not snowfall: a warmer winter can deliver the same water as rain.
2025-26 is the reminder to hold all of it loosely. The ocean index was mildly negative, nobody called it a big year, and Chardon still finished at 117.3 inches while Columbus and Dayton both beat their normals comfortably. We cover the same disagreement nationally in our breakdown of forecast methods.
What happened in Ohio during past strong El Nino winters?
Every station lost snow on average. We took the seven winters since 1949 where the ocean index reached 1.5 or higher and expressed each station's total as a share of its own long-run average. The results run from 54 percent at Mansfield to 73 percent at Cleveland.
| Station | Strong El Nino average | Share of its own mean | Very strong only |
|---|---|---|---|
| Mansfield | 22.7" | 54% | 48% |
| Dayton | 15.0" | 55% | 36% |
| Toledo | 21.3" | 60% | 51% |
| Columbus | 16.6" | 60% | 47% |
| Chardon | 71.6" | 68% | 64% |
| Akron-Canton | 31.9" | 68% | 65% |
| Cincinnati | 16.6" | 71% | 81% |
| Youngstown | 43.6" | 72% | 70% |
| Cleveland | 42.3" | 73% | 60% |
The seven seasons are 1957-58, 1972-73, 1982-83, 1991-92, 1997-98, 2015-16 and 2023-24. The final column narrows to the three where the index reached 2.0 or higher, which is the category NOAA currently expects this winter to enter.
Two cells in that table rest on fewer seasons than the rest, and we would rather say so than round it over. Chardon has too many missing days in 2015-16 to use, so its figures come from six strong winters and two very strong ones. Mansfield's 1957-58 is missing for the same reason, so its 54 percent is six winters, not seven. Every other row uses the full seven and three.
The stations that lost the most
Mansfield and Dayton, which is not where most people would guess. In the three very strong El Nino winters Dayton managed 36 percent of its own average and Mansfield 48 percent. Dayton's worst of those, 1982-83, produced 5.5 inches for the entire season and remains its lowest on record.
The stations that lost the least
Cincinnati, which is stranger still. In the very strong winters it held 81 percent of its own average, the best of the nine, and in 1997-98 it actually finished at 134 percent, the 78th percentile of its whole record. The Ohio Valley station was the most resilient one in the state.
Does a strong El Nino always mean less snow in Ohio?
No, and the exceptions matter. Cleveland finished at 119 percent of its average in the strong El Nino of 1972-73 and 114 percent in 1991-92. Cincinnati's 1997-98 ran to 134 percent. A pattern that holds on average across seven winters still breaks in individual years.
2015-16 is the most useful warning. It carried the highest ocean index in the entire record at 2.5, well past the 2.0 mark NOAA expects this winter to cross, and Ohio's response was mixed rather than catastrophic. Youngstown finished at the 24th percentile of its own record and Toledo at the 31st, which is a below-normal winter but nothing anybody would call a collapse.
We also ran the reverse test to make sure the signal was real. In La Nina winters, where the index fell to minus 1.0 or lower, the same nine stations came out at Toledo 108 percent, Youngstown 107, Cleveland 104, Columbus 103, Mansfield 101, Dayton 100, Akron-Canton 99, Chardon 96 and Cincinnati 87. Essentially normal, which is what makes the El Nino deficit look like a genuine effect rather than an artifact of how we built the seasons.
When does it usually start snowing in Ohio?
Northern Ohio gets its first inch around the middle of November and southern Ohio waits until early December. The median first inch falls on 16 November at Chardon and Youngstown, 21 November at Cleveland, and 11 December at Columbus, which is nearly a month later for a three-hour drive.
The spread around those medians is what catches people out. Chardon has had its first inch as early as 8 October and as late as 28 December. Cincinnati's latest first inch in the modern record was 6 March, in 2011-12, meaning that entire winter passed without a single inch of snow until the season was almost over.
| Station | Median first 1" | Earliest since 1991 | Latest since 1991 | Median last 1" |
|---|---|---|---|---|
| Chardon | 16 Nov | 8 Oct (2000-01) | 28 Dec (2001-02) | 29 Mar |
| Youngstown | 16 Nov | 18 Oct (1992-93) | 4 Jan (2015-16) | 25 Mar |
| Cleveland | 21 Nov | 26 Oct (2001-02) | 10 Jan (2015-16) | 27 Mar |
| Akron-Canton | 22 Nov | 30 Oct (1993-94) | 12 Jan (2015-16) | 24 Mar |
| Mansfield | 5 Dec | 18 Oct (1992-93) | 28 Jan (2006-07) | 19 Mar |
| Toledo | 5 Dec | 20 Oct (1992-93) | 21 Jan (2006-07) | 15 Mar |
| Cincinnati | 6 Dec | 30 Oct (1993-94) | 6 Mar (2011-12) | 7 Mar |
| Dayton | 8 Dec | 23 Oct (2013-14) | 3 Feb (2021-22) | 8 Mar |
| Columbus | 11 Dec | 30 Oct (1993-94) | 21 Jan (2006-07) | 5 Mar |
Three of those latest-first-inch dates fall in the winter of 2015-16, the record El Nino, which is one of the clearest fingerprints the pattern leaves on Ohio. The snow did arrive that year, but it started weeks late across the north.
Which month gets the most snow in Ohio?
January, at all nine stations without exception. Chardon normals 34.4 inches in January alone, Cleveland 18.4 and Cincinnati 7.7. February runs second everywhere except Chardon and Youngstown, where December edges it out, and March still outsnows November across the whole state.
| Station | Oct | Nov | Dec | Jan | Feb | Mar | Apr |
|---|---|---|---|---|---|---|---|
| Chardon | 0.6" | 9.3" | 25.5" | 34.4" | 23.4" | 16.5" | 4.0" |
| Youngstown | 0.7" | 4.5" | 14.8" | 19.6" | 15.1" | 10.5" | 2.6" |
| Cleveland | 0.1" | 4.5" | 12.2" | 18.4" | 15.1" | 10.8" | 2.7" |
| Mansfield | 0.5" | 2.3" | 9.7" | 14.5" | 12.7" | 7.6" | 1.9" |
| Akron-Canton | 0.3" | 3.3" | 8.9" | 13.4" | 12.0" | 7.6" | 1.7" |
| Toledo | 0.1" | 1.7" | 6.5" | 12.3" | 10.2" | 5.3" | 1.3" |
| Columbus | 0.2" | 1.2" | 5.1" | 9.5" | 7.6" | 4.1" | 0.5" |
| Dayton | 0.2" | 0.8" | 4.8" | 8.3" | 6.6" | 3.9" | 0.4" |
| Cincinnati | 0.2" | 0.8" | 4.1" | 7.7" | 6.7" | 3.4" | 0.4" |
April is not empty either. Akron-Canton's biggest single calendar day in 77 years of records is 19.7 inches, and it fell on 4 April 1987. A snowbelt April can still deliver a foot.
What was Ohio's snowiest winter on record?
Chardon holds the highest season in this set at 161.5 inches, in 1959-60. Cleveland's best is 117.9 inches in 2004-05, Youngstown's 118.7 in 2010-11, and Toledo and Columbus both peaked in 2013-14 at 86.3 and 56.4 inches. Ohio has no single snowiest winter, only nine of them.
Advertisement
One labelling note, since we have been picky about station identity elsewhere. The National Weather Service page for Cleveland calls that 117.9 inch season 2005-06. Our season runs July to June, so we call it 2004-05, and the daily record settles it: 35.1 inches fell in December 2004 and 32.8 in January 2005.
Three of the nine set their record in the same winter, 1977-78: Akron-Canton at 82.0 inches, Dayton at 62.7 and Cincinnati at 53.9. That was the season of the January 1978 blizzard, and in southwest Ohio it still stands as the benchmark nearly fifty years later.
What was Ohio's least snowy winter on record?
2023-24, for four of the nine stations at once. Chardon's 39.9 inches, Mansfield's 8.4, Akron-Canton's 15.0 and Toledo's 9.6 are each the lowest that station has ever recorded. Mansfield finished that winter at 20 percent of its own long-run average.
That winter carried an ocean index of 1.84, firmly in strong El Nino territory, and it is the single most useful analogue in the record for what NOAA is currently forecasting. Cleveland and Youngstown set their own record lows one year earlier in 2022-23, and Dayton's stands at 5.5 inches from the strong El Nino of 1982-83.
How much snow will Ohio get this winter?
No forecaster has published an Ohio snowfall total for 2026-2027, and this guide does not either. What the record gives you is a baseline and a discount. Ohio's nine stations normal between 23.3 and 113.7 inches, and in strong El Nino winters they have averaged 54 to 73 percent of that.
Putting those two columns side by side is the closest thing to an honest answer anyone can give you in August. The right-hand column is not a forecast for this winter. It is what each station actually did, on average, in the seven winters that most resemble the one NOAA is describing.
| Station | Normal season | Average in strong El Nino winters |
|---|---|---|
| Chardon | 113.7" | 71.6" |
| Youngstown | 67.8" | 43.6" |
| Cleveland | 63.8" | 42.3" |
| Mansfield | 49.2" | 22.7" |
| Akron-Canton | 47.2" | 31.9" |
| Toledo | 37.4" | 21.3" |
| Columbus | 28.2" | 16.6" |
| Dayton | 25.0" | 15.0" |
| Cincinnati | 23.3" | 16.6" |
What is the snow forecast for northeast Ohio?
Northeast Ohio has the most snow to lose and the most left over after losing it. Chardon normals 113.7 inches, Youngstown 67.8 and Akron-Canton 47.2, and even at 68 percent of average, a strong El Nino still leaves Chardon somewhere near 72 inches for the season.
That is the practical point about the snowbelt in an El Nino year. A 30 percent cut to Cincinnati takes it from 23.3 inches to roughly 17, which changes very little about anybody's winter. The same proportional cut in Geauga County still leaves more snow than Columbus gets in its snowiest season on record.
Northeast Ohio also holds its snow the longest. Chardon's median last inch falls on 29 March and Youngstown's on 25 March, against 5 March at Columbus. The season up there is roughly three weeks longer at both ends than it is in the centre of the state.
How much snow will Cleveland get this winter?
Cleveland normals 63.8 inches a season and averaged 42.3 inches across the seven strong El Nino winters, or 73 percent of its own long-run mean. Its full range over 77 seasons runs from 22.7 to 117.9 inches. Nobody can give you a figure for 2026-2027, and anyone who does is guessing.
Cleveland is also the station with the two clearest exceptions in the state, finishing above its average in two separate strong El Nino winters. If you need a planning figure rather than a forecast, the strong El Nino average of 42.3 inches is the most defensible one available, and it should be held loosely.
How much snow will Columbus get this winter?
Columbus normals 28.2 inches and averaged 16.6 in the seven strong El Nino winters, dropping to 12.9 in the three very strong ones. Its record range runs from 6.5 inches in 1949-50 to 56.4 in 2013-14, so the spread on any single season is enormous relative to the average.
Central Ohio is one of the areas the record suggests is most exposed this winter. Columbus lost 40 percent of its snow in strong El Nino seasons and 53 percent in the very strong ones, a steeper fall than either Cleveland or Cincinnati. Last winter it went the other way and finished at 33.9 inches, well above normal.
How much snow will Cincinnati get this winter?
Cincinnati normals 23.3 inches and is the least affected of the nine by strong El Nino winters, holding 71 percent of its average across the seven, and 81 percent across the three strongest. It has run from 5.6 inches in 2011-12 to 53.9 in 1977-78.
We cannot explain why the Ohio Valley station holds up better than the ones north of it, and we are not going to invent a mechanism to cover the gap. The El Nino storm track shifting south is the usual explanation offered, and it is consistent with Cincinnati's 1997-98, when the city took 31.4 inches inside one of the strongest El Ninos on record.
How many days a year does it actually snow in Ohio?
Ohio snows far more often than it accumulates. In a median winter Youngstown records 52 days carrying a tenth of an inch or more, but only 20 days with a full inch. Cincinnati records 21 and seven. Most Ohio snow days are nuisance days rather than shovelling days.
| Station | Days with 0.1" or more | Days with 1" or more | Days with 6" or more |
|---|---|---|---|
| Youngstown | 52 | 20 | 0.9 |
| Chardon | 46 | 32 | 3.9 |
| Akron-Canton | 45 | 15 | 0.5 |
| Cleveland | 43 | 17 | 1.4 |
| Mansfield | 35 | 14 | 0.8 |
| Toledo | 29 | 10 | 0.8 |
| Columbus | 25 | 8 | 0.3 |
| Dayton | 23 | 7 | 0.3 |
| Cincinnati | 21 | 7 | 0.4 |
The Chardon row is the one that separates the snowbelt from everywhere else. It has fewer snow days than Youngstown but far more heavy ones, averaging almost four days a season with six inches or more, against 0.3 at Columbus. Lake effect does not spread its snow out. It concentrates it.
What does this mean if you are driving through Ohio this winter?
The risk is concentrated in a narrow band rather than spread across the state. Interstate 90 east of Cleveland and Interstate 271 through Geauga and Lake counties run straight through the snowbelt, where four days a season bring six inches or more and visibility can drop to nothing in minutes.
Lake effect is intensely local in a way that frontal snow is not. It is entirely normal for I-90 to be clear at Cleveland and impassable at Ashtabula on the same afternoon, which is why a statewide forecast is close to useless for a drive across northern Ohio. Check conditions for the segment you are on, not the state.
Ohio's Department of Transportation runs live traffic and road condition cameras at OHGO, which is the resource to use on the day. For the wider Great Lakes picture, the pattern that drives all of this is the same one we cover in our Michigan snow guide, and the eastern end of the same snowbelt runs into our Pennsylvania guide and the Pittsburgh winter forecast.
How to prepare for an Ohio winter trip
Plan around the two-week window rather than the season. January is the snowiest month at every station in the state, and the second half of it carries the highest odds of a genuinely disruptive event, so a trip built with slack in mid-January is worth more than one built on any seasonal outlook.
- Book flexible fares for travel between the middle of December and the end of February, which is when eight of the nine stations take most of their snow.
- If you are driving I-90 or I-271, check the road segment on the morning of travel rather than the night before. Lake effect bands set up and dissipate within hours.
- Northeast Ohio holds snow on the ground far longer than the southwest. Chardon's median last inch falls on 29 March, three weeks after Columbus.
- Carry a scraper, a blanket and a full tank in the snowbelt counties even for short drives. The Weather Service's winter preparedness checklist covers the rest.
- Do not assume a mild forecast means a snowless one. 2025-26 was a neutral-to-La-Nina winter that nobody flagged, and Chardon still took 117.3 inches.
The honest limits of any Ohio snow prediction
Seasonal outlooks predict pattern, not totals. No forecaster, including NOAA, publishes a credible snowfall number in inches for an Ohio city five months ahead, and this guide does not either. What we have done is show you what the state does in winters that resemble the one being forecast.
Three limits are worth stating plainly. The El Nino relationship is an average across seven winters, and two of those seven ran above normal at Cleveland. The station record cannot tell you about a single storm, and one blizzard can rewrite a season, as 1977-78 did in southwest Ohio. And the outlook itself will change: NOAA updates its ENSO discussion monthly and does not release its winter outlook until mid-October.
Our figures come from the NOAA Regional Climate Centers ACIS database, rebuilt from daily station values with traces counted as zero and any season missing more than five days of the October to April core discarded. The National Weather Service offices for Cleveland and Wilmington publish the local climatology this is built on. For how Ohio fits the national picture, see our USA winter snow predictions hub.
Topics
Advertisement